Debugging – the technique one uses most and is inevitable. If only there was a tool that allowed us to make this sometimes-tedious task much easier and not-so-tedious… oh wait. There is.

Eclipse allows to start a Java programin in the so-called Debug mode. What it is most useful for is that it allows you to control the execution flow by using debug comamnds.
You can set line breakpoints, conditional breakpoints and/or exception breakpoints.
Starting the debugging process
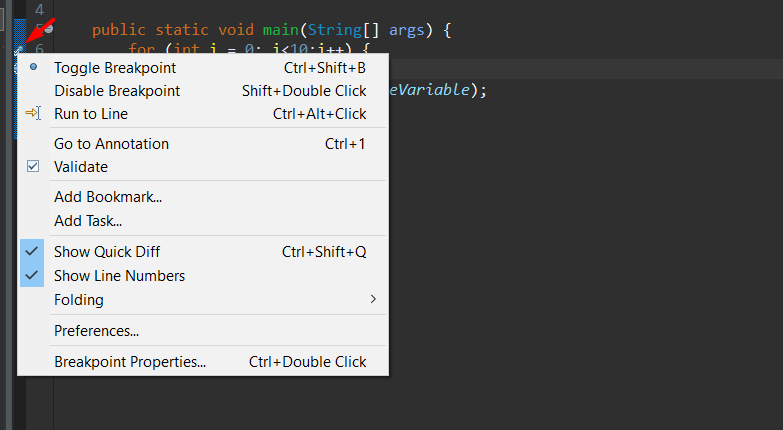
To initialize a breakpoint in your code, right click on the left margin in the Java Editor and select Toggle Breakpoint, like so:
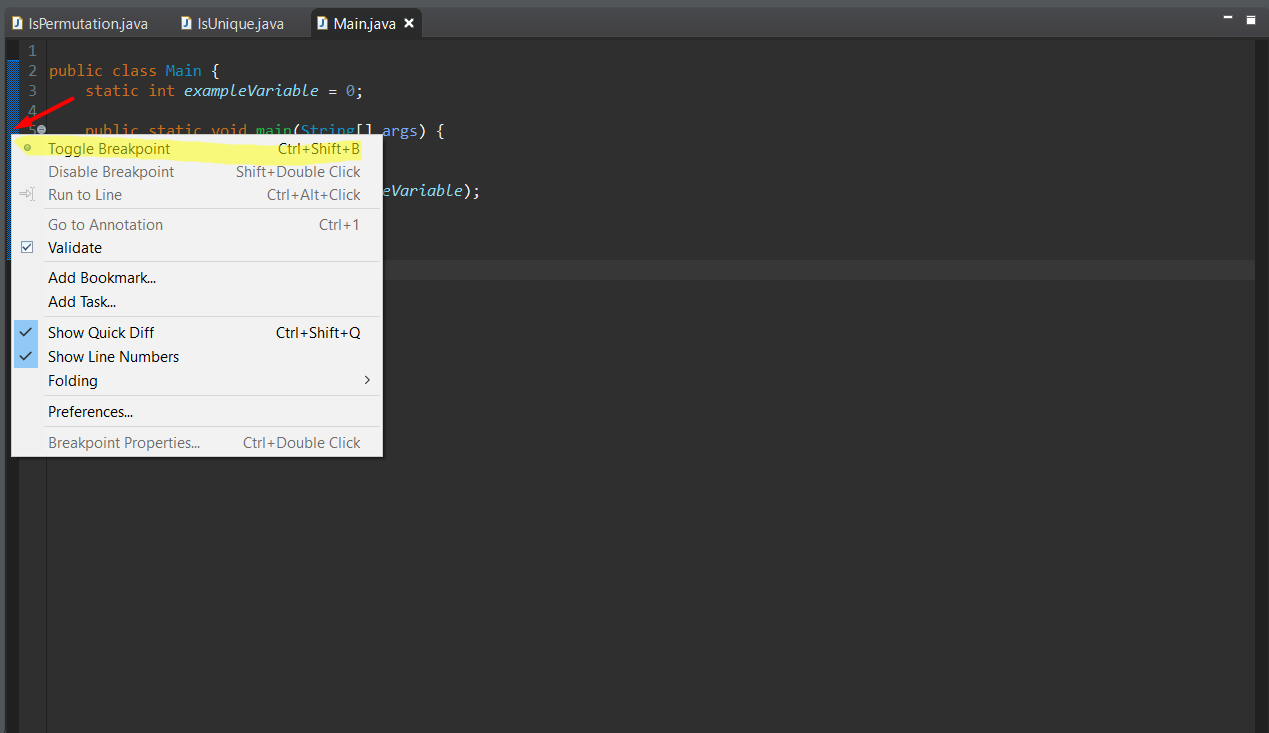
What you can also do is (which is slightly quicker way, I guess) to double click on the left margin again (where the Red Arrow is pointing at). Whichever works for you, they are quite the same ways.
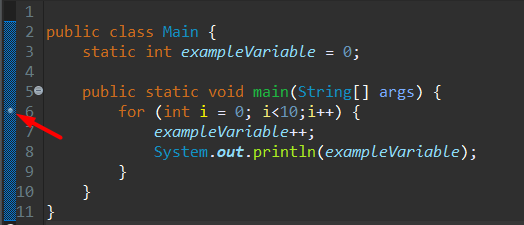
In my case, I added a breakpoint at the beggining of my for loop:
Now it is time to run the program in Debug mode. There are 3 ways of doing it:
- Click the “Run” command in main menu and then select “Debug”
- Press F11
- Click on the bug-like icon that is on the top panel and select “Debug As Java Application”
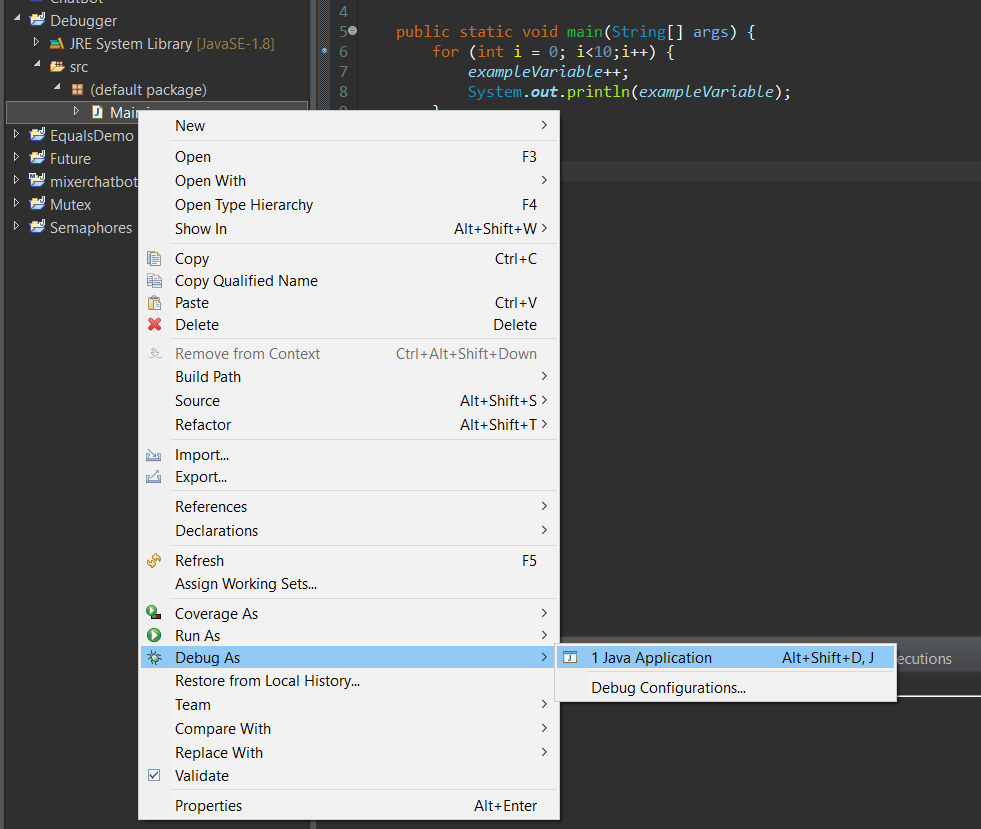
Please note, to debug the program, you need to have defined breakpoints.
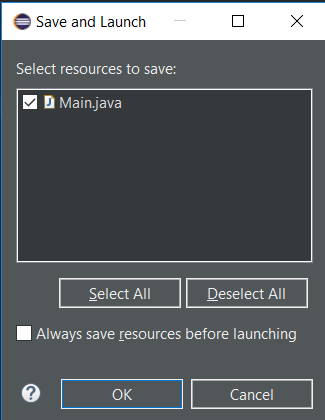
This screen will be prompted after you have selected “Java application” from the picture above this one. Click OK.
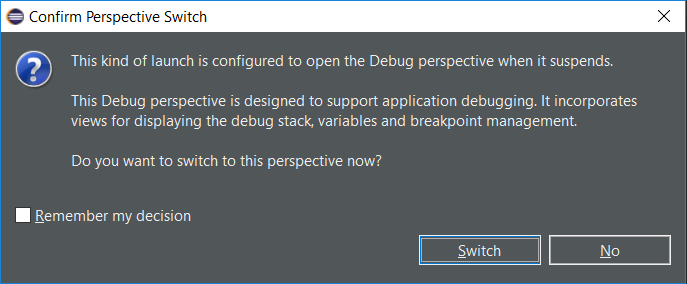
This window will be invoked because Eclipse wants to know if you want to switch to Debug perspective once a stop point has been reached. Click on “Switch”.
Controlling the debugging process
You will find buttons on the top panel whose purpose is to help you control the execution of the program you decided to debug.
![]()
However, you can also use key bindings that are as follows:
![]() : what this button does is resume the execution of the program until it reaches the next breakpoint (F8)
: what this button does is resume the execution of the program until it reaches the next breakpoint (F8)
![]() : terminates the current running server, not eclipse (CTRL + F2)
: terminates the current running server, not eclipse (CTRL + F2)
![]() : executes the currently highlighted line and jumps over the next one. It is important to note that if the currently highlighted line is a function call, the debugger will step into the function (F5)
: executes the currently highlighted line and jumps over the next one. It is important to note that if the currently highlighted line is a function call, the debugger will step into the function (F5)
![]() : executes a method without the debugger actually stepping into it, also called a “step over” (F6)
: executes a method without the debugger actually stepping into it, also called a “step over” (F6)
![]() : finishes the execution of the current method and jumps back to the caller of the method (F7)
: finishes the execution of the current method and jumps back to the caller of the method (F7)
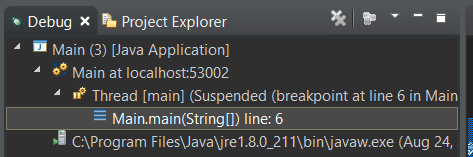
Debug view
Variables & Expression view
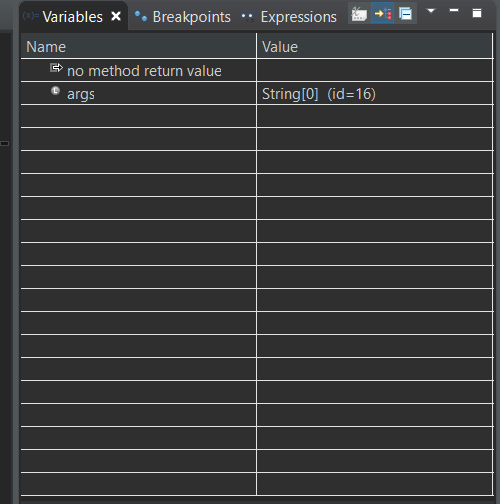
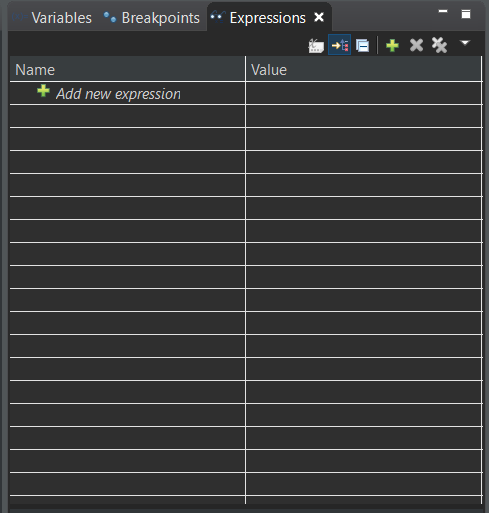
These views provide a showcase of the declared variables and their associated values.
Breakpoint View
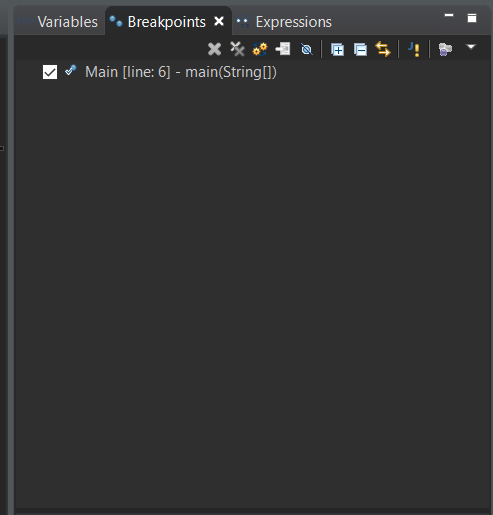
It basically does what its name is – displays all the breakpoints. In my case, I only have 1 breakpoint which happens to be on line 6.
Console view
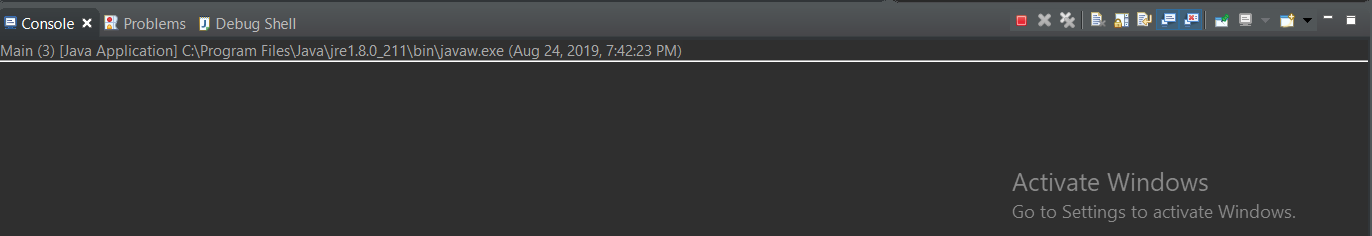
With this view you are probably already familiar with – this is the actual output of the program.
Simple example using these views
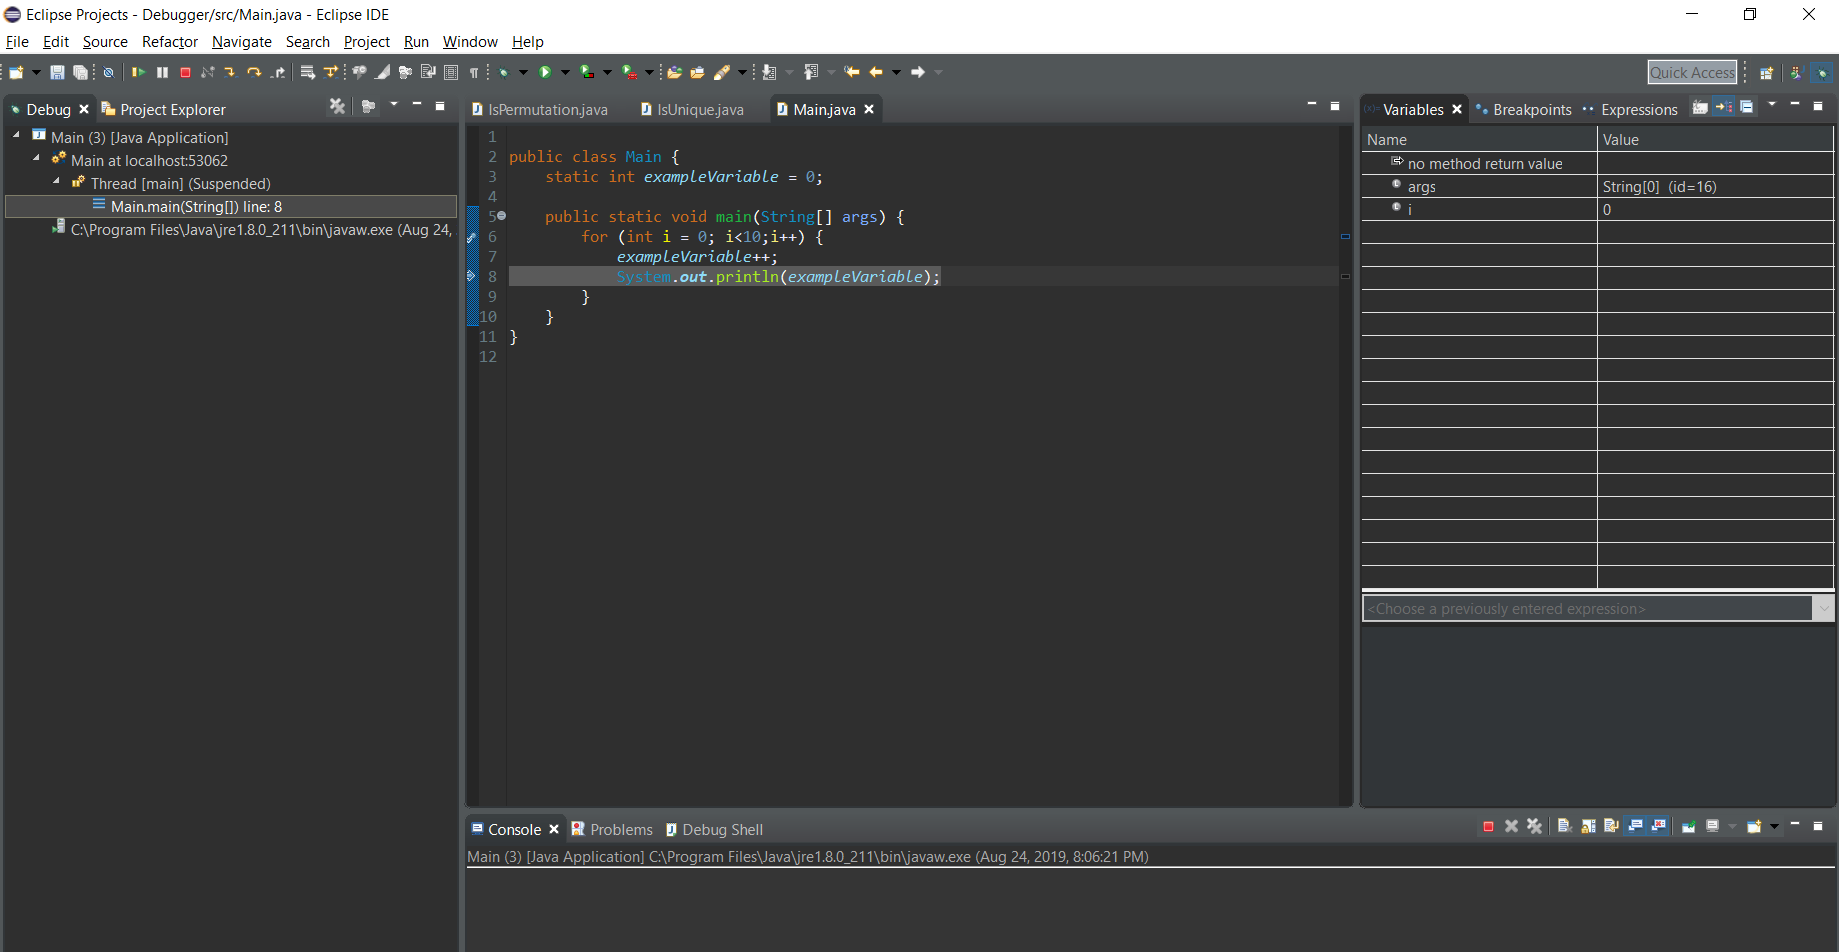
Starting from line 6 in the code above (from the for loop), after clicking F5, we get this result:
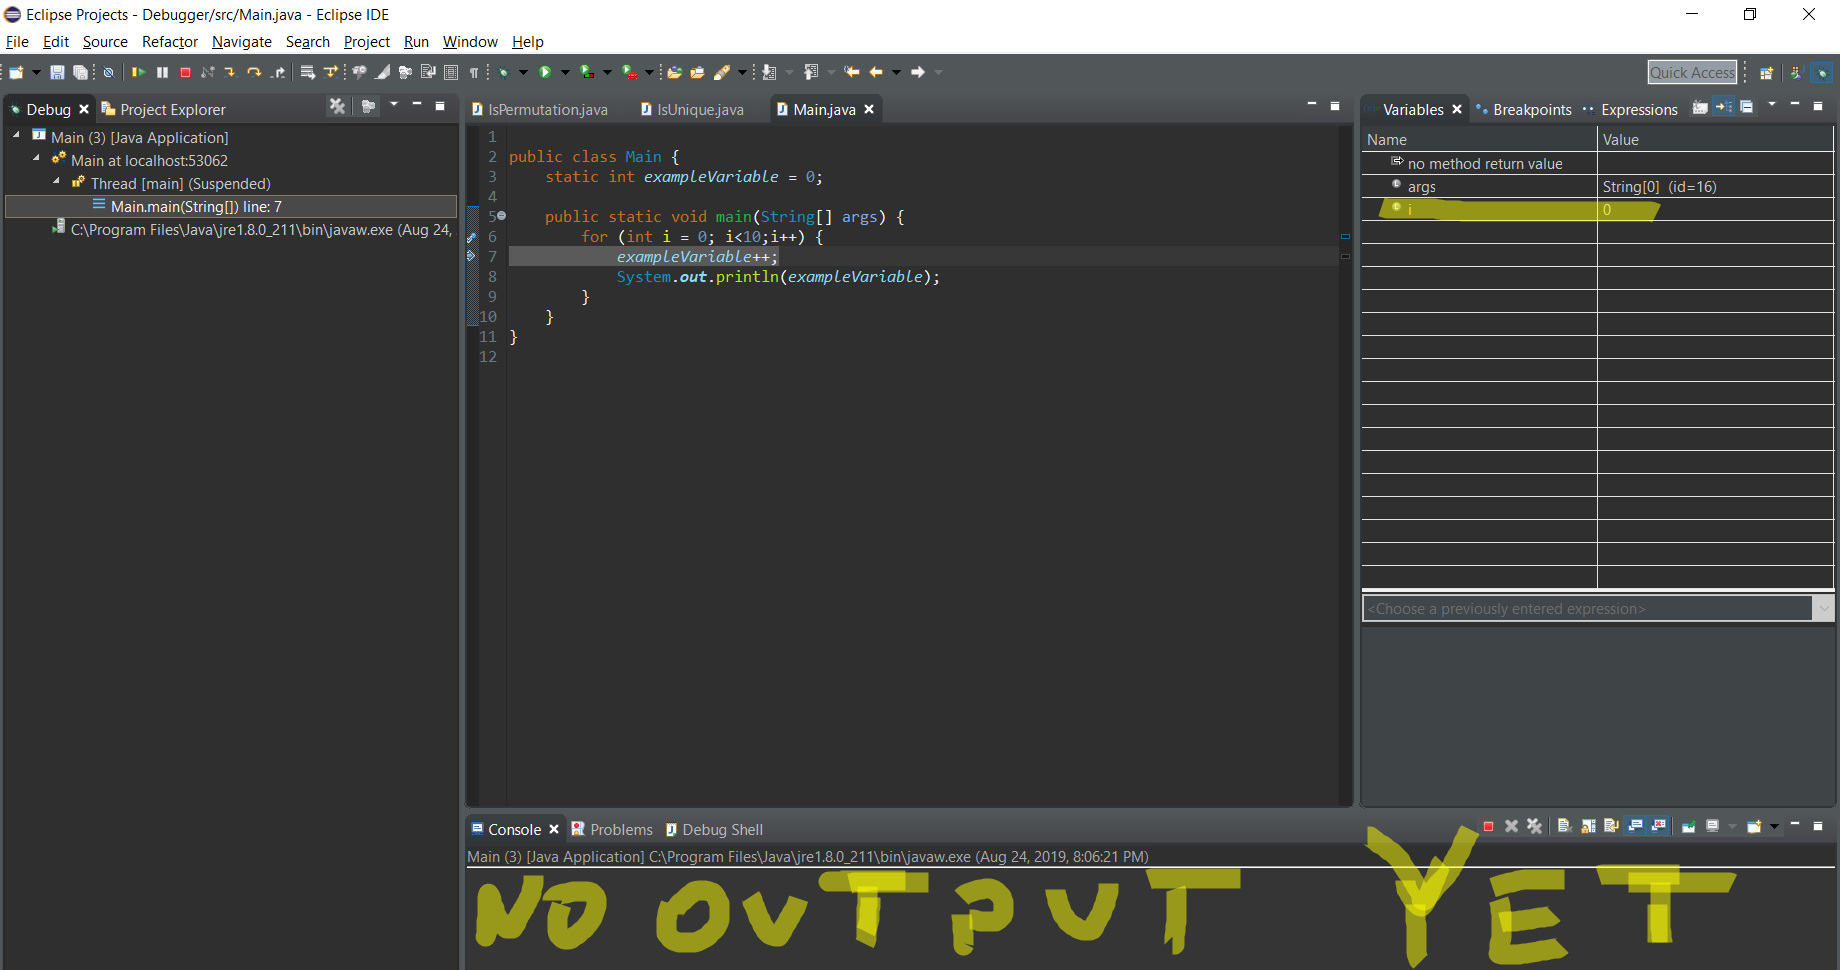
So, after clicking F5, we get into the loop (line 7) and if you look at the Variables view, you will see that ‘i’ has been initialized to 0 (line 6).
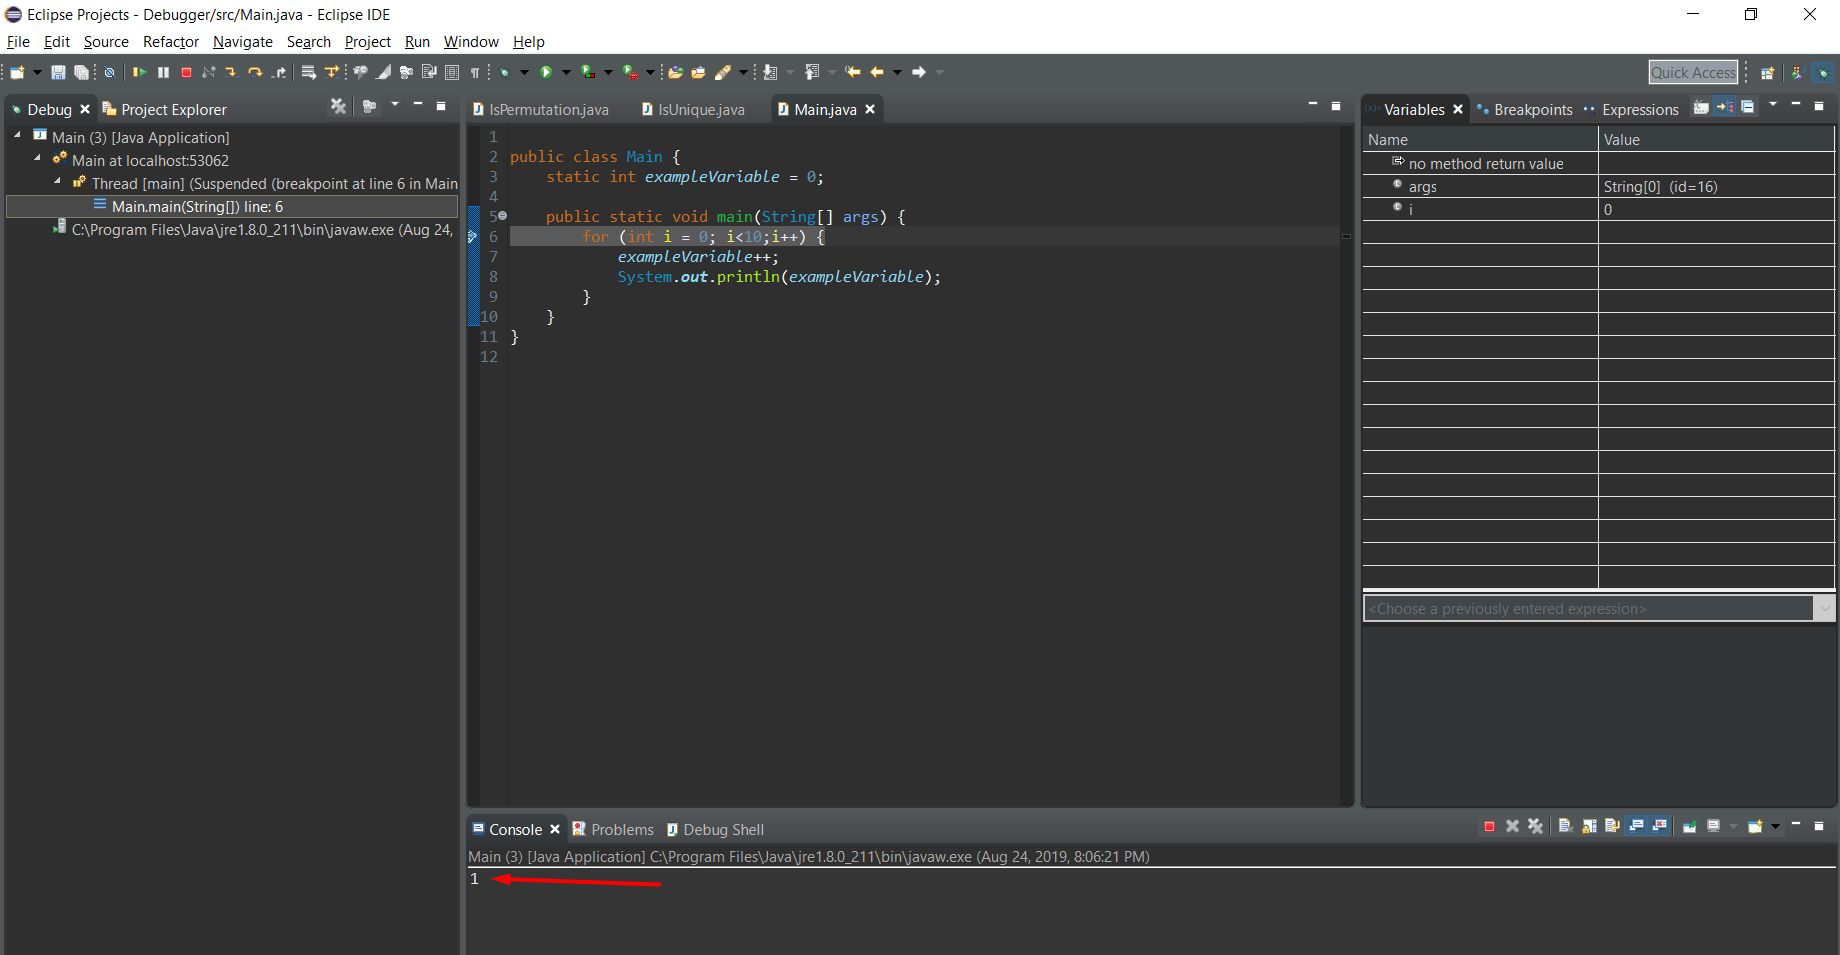
Now, let’s click on F5 again.
Nothing has changed, because we added 1 to exampleVariable, but that’s it. Now that we are on line 8, let’s click on F5 and see what happens.
We got out first output! And that is because we ran the System.out.println() statement. What do you think is going to happen now when I press F5?
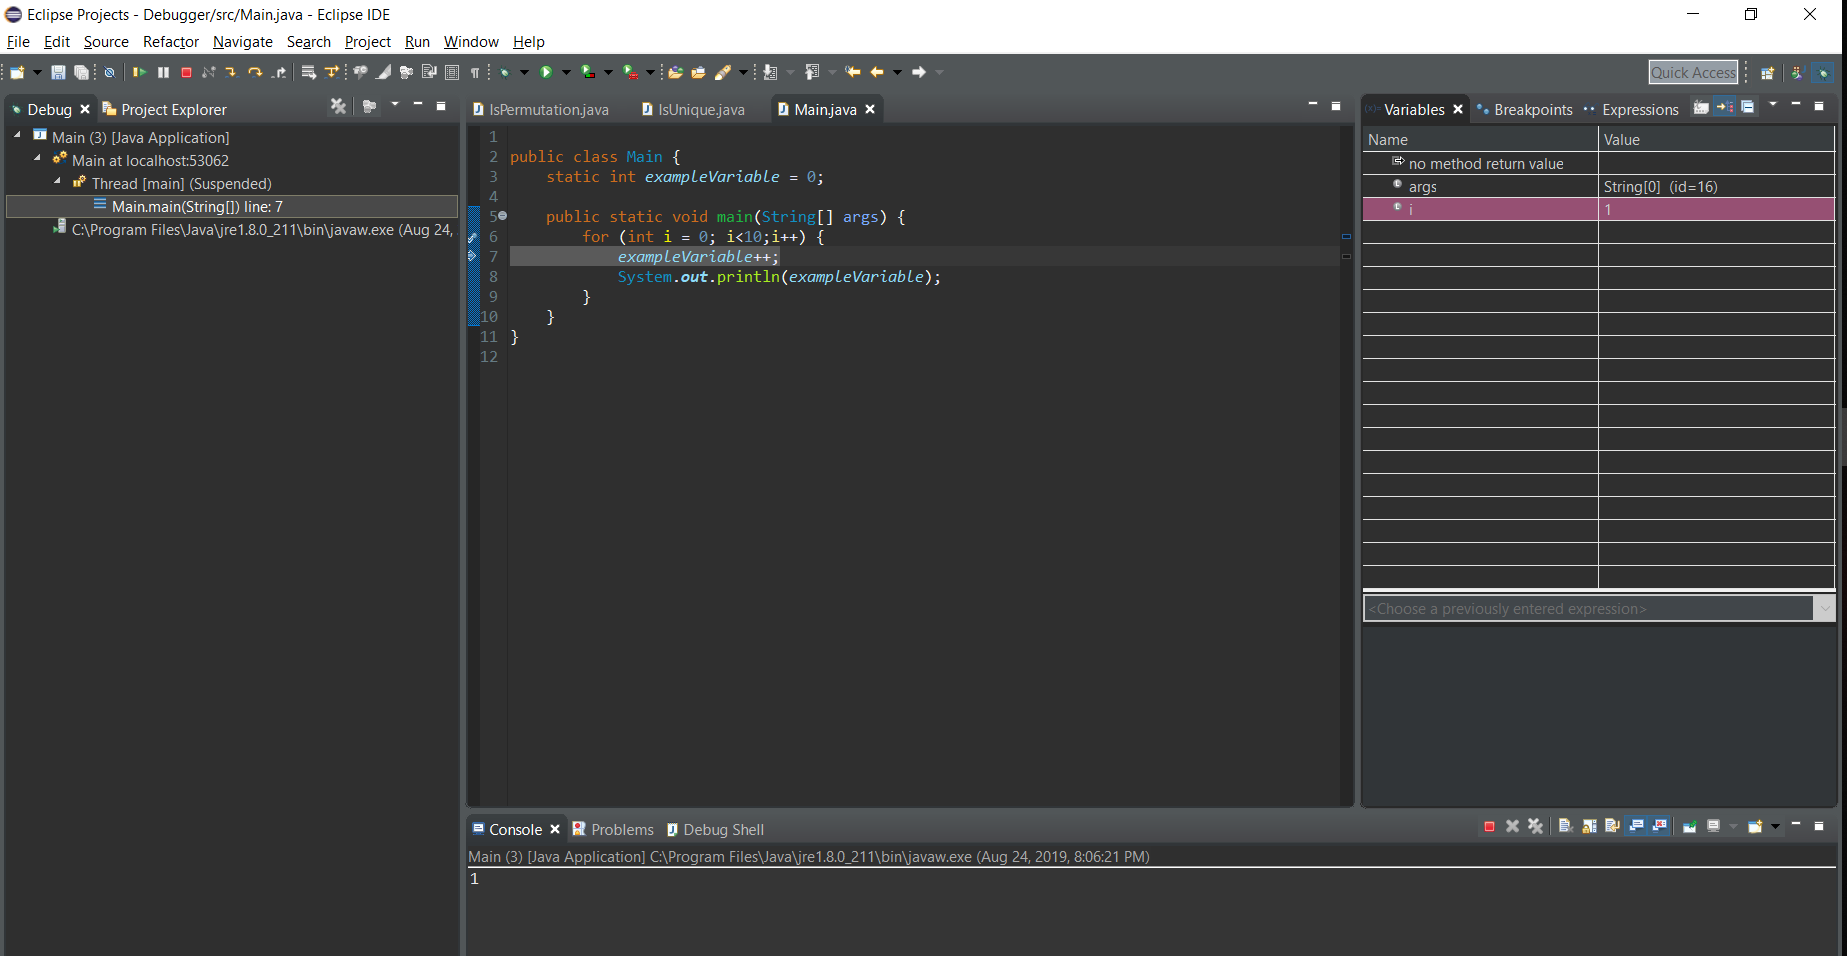
If you said ‘i’ would change to 1 then you would have been right! You can see on the right that ‘i’ got highlighted as it changed its value.
That is the basic process of debugging.
Let’s look at some more functionality that Eclipse’s Debugger tool provides us with.
Watchpoints
Unlike breakpoints, watchpoints are used to stop the execution of an apllication whenever the value of a filed changes (without specifying it was going to).
You can easily enable Watchpoints by specifying that in the Breakpoint Properties. To access Breakpoint properties, right click on the breakpoint you have put on the left of the code and select “Breakpoint Properties”, like so:
Then you have a couple of options. You can tick “Conditional” and then select “Suspend when ‘true'” or “Suspend when value changes”. Even more, you can specify a certain condition in the space below that if it evaluates to true, it will suspend the termination.
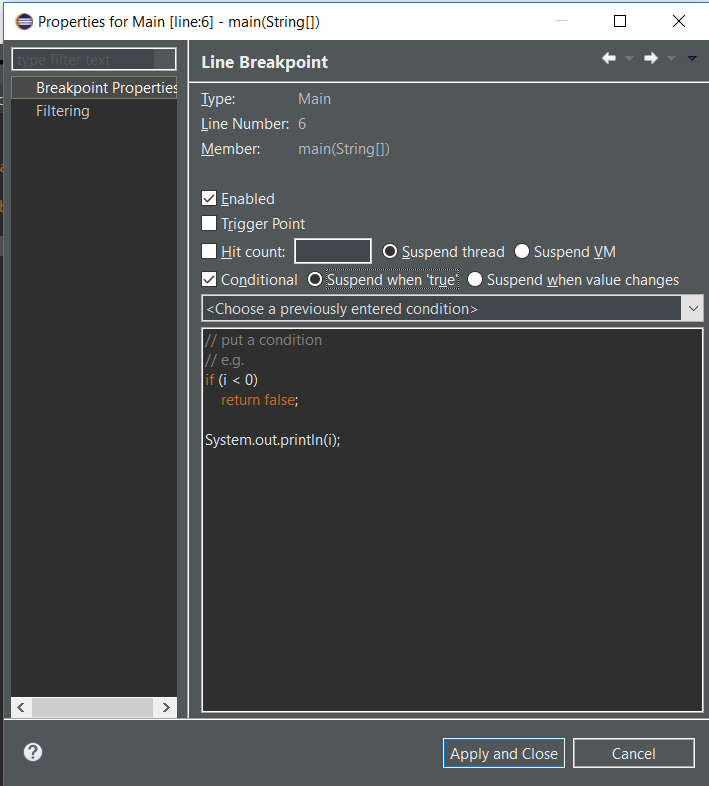
These are called “Condition breakpoints”.