In the previous tutorial you learned how to create a simple Android app. This tutorial will explain how to run and debug your Android application in Android Studio.
Explanation
Android studio has its own default run/debug configuration which is sufficient for our needs. However if you want to create your own configuration or modify the default one, you can also go for it. When you run your app on a hardware device, Android Studio creates an APK file of your app, install and run on your device. It handles most of the details for you. Running and debugging your apps in Android Studio is very easy. Let’s start.
Run Android application
Follow these steps to run your app.
- Open your app in Android Studio.
- On the run/debug configuration page, enter your configuration name and select module (this step is optional if you don’t want to use default run/debug configuration).
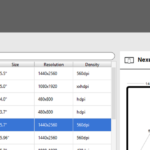
- Set your Android device, make sure you have installed appropriate USB driver, enable USB debugging and select deployment target (For more details see the previous tutorial how to configure Android device).
- Click on the Run icon on menu bar or run your app by right clicking on root folder and then select Run.
- I run previous example of tutorial (simple Android app). Here are results
- My device is showing in deployment target windows. Select it and run.
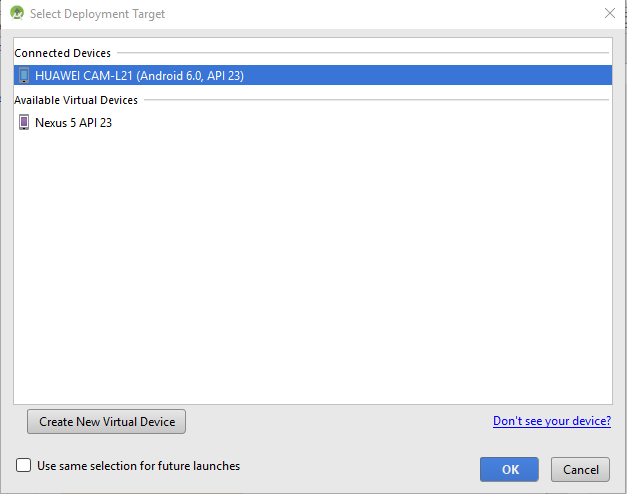
Select Deployment Target
It will start installing your app in your device. After installation here it creates shortcut.
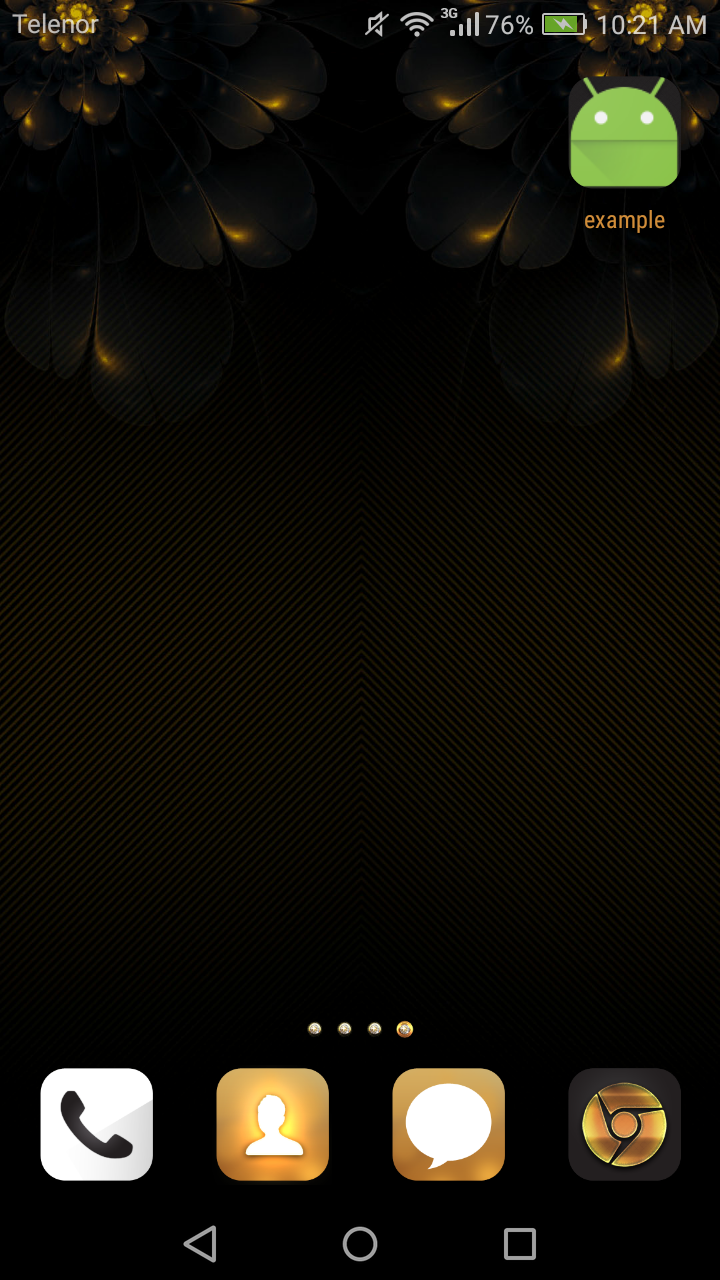
App shortcut
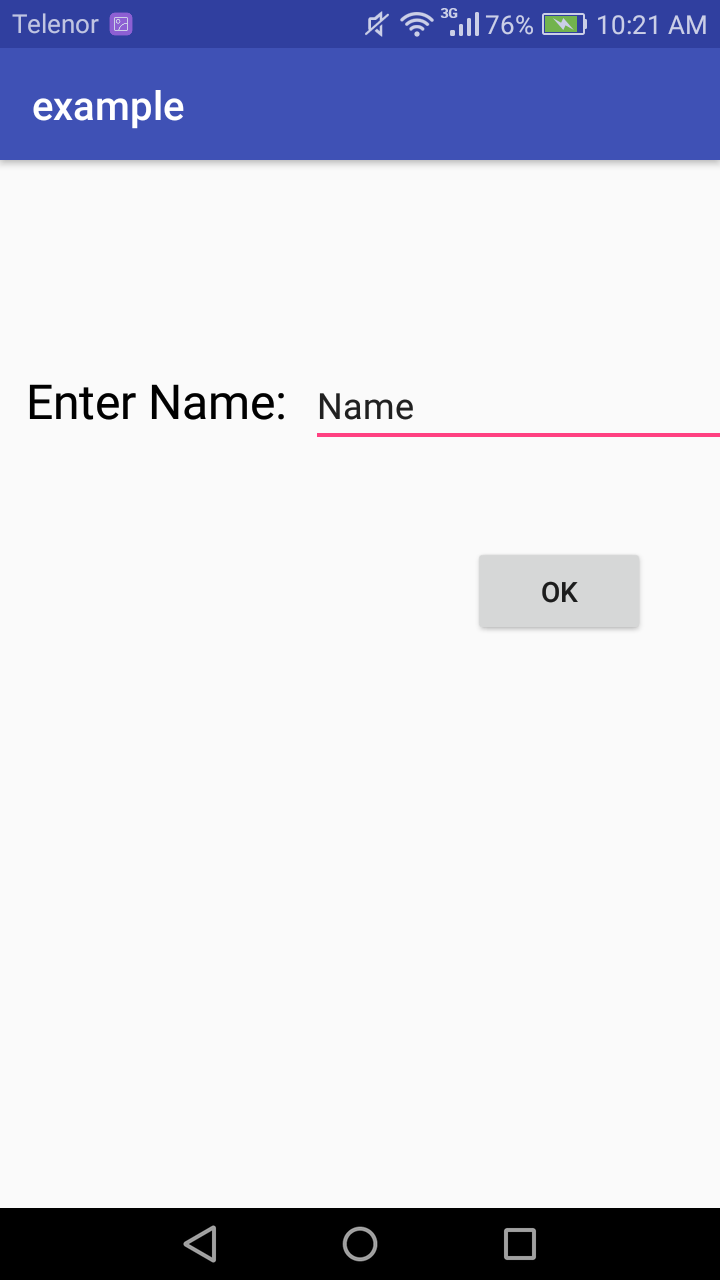
App running on Android device
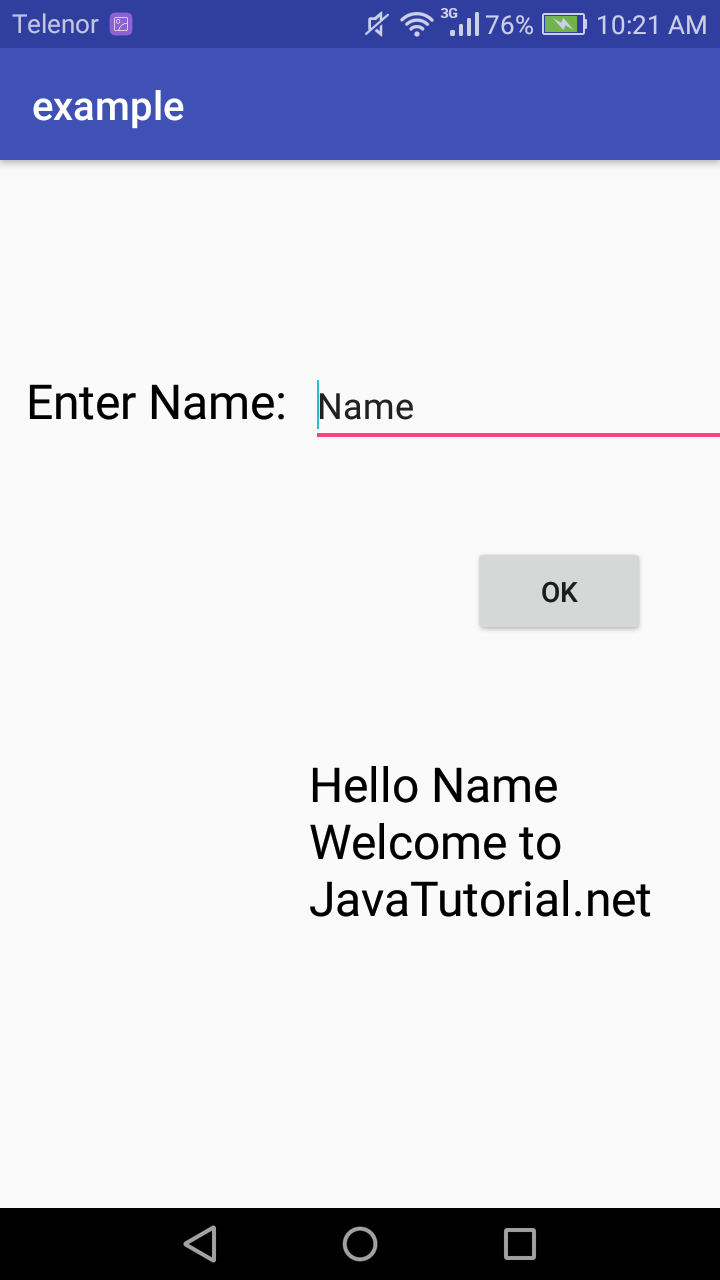
App running on Android device
Debug Android application
Debugging is the process of finding errors.Android Studio also provides a mechanism to debug your apps running on virtual Android device or hardware Android device. Android debugger provides following facilities.
- Choose device to debug your app
- Set breakpoints in your code
- Examine flow of expressions at run time.
- Allows to capture screenshots and videos
Before starting debugging make sure that build variant sets debuggable property to true.
For this go to Build => Select build variant. To start debugging click on the debug icon on the menu bar. After building and installing on Android device, it will open debug window.
- Select debug icon on the screen menu.
- Choose your device in deployment target window.
- Then choose process what you want to attach to the debugger.
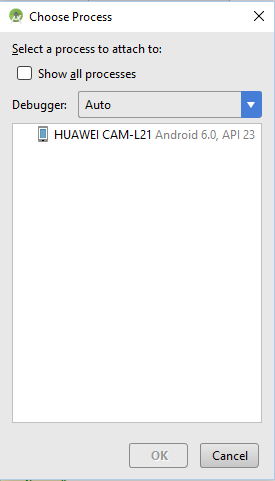
Choose process
- Click OK.
- You will see the debug window and console will say connected to the device.
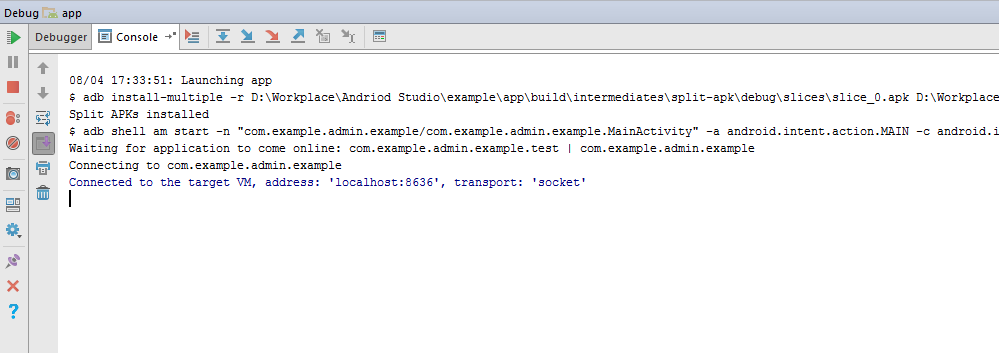
Console message
Below figure shows debugger window, showing current thread.
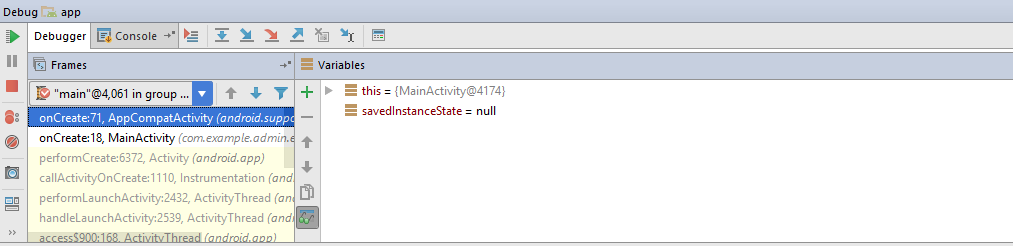
Debugger window
Click terminate to end a debugging session.