What are unit tests?

Unit tests are a method of software testing in which small components of a Java application are being tested. Its purpose is to confirm the fact that every piece of the software behaves as expected. And even if it is, you can use unit testing to determine whether another implementation would give better result in terms of memory and performance. If you are not very familiar with Unit Testing, I suggest following this tutorial on the topic.
What is profiling?
Profiling examines an application and tries to locate memory or performance issues that are associated with a Java application.What it allows you to do is obtaining data about the performance, method timing, object allocation, etc. by monitoring the JVM (Java Virtual Machine).
You can use the IDE to profile theses types of Java applications:
- Java EE/Web applications
- Java free-form projects
- Java SE projects
- NetBeans modules and module suites
JProfiler (Ej-Technologies)
When it comes to profiling tools, JProfiler is the best choice for many developers. It has relatively easy-to-use interface that helps inspecting the system performance, memory usage, memory leaks (if any) and thread profiling.
With all this information provided, we can diagnose our application’s behaviour and change it if we need to. Note that the image below shows a running application.
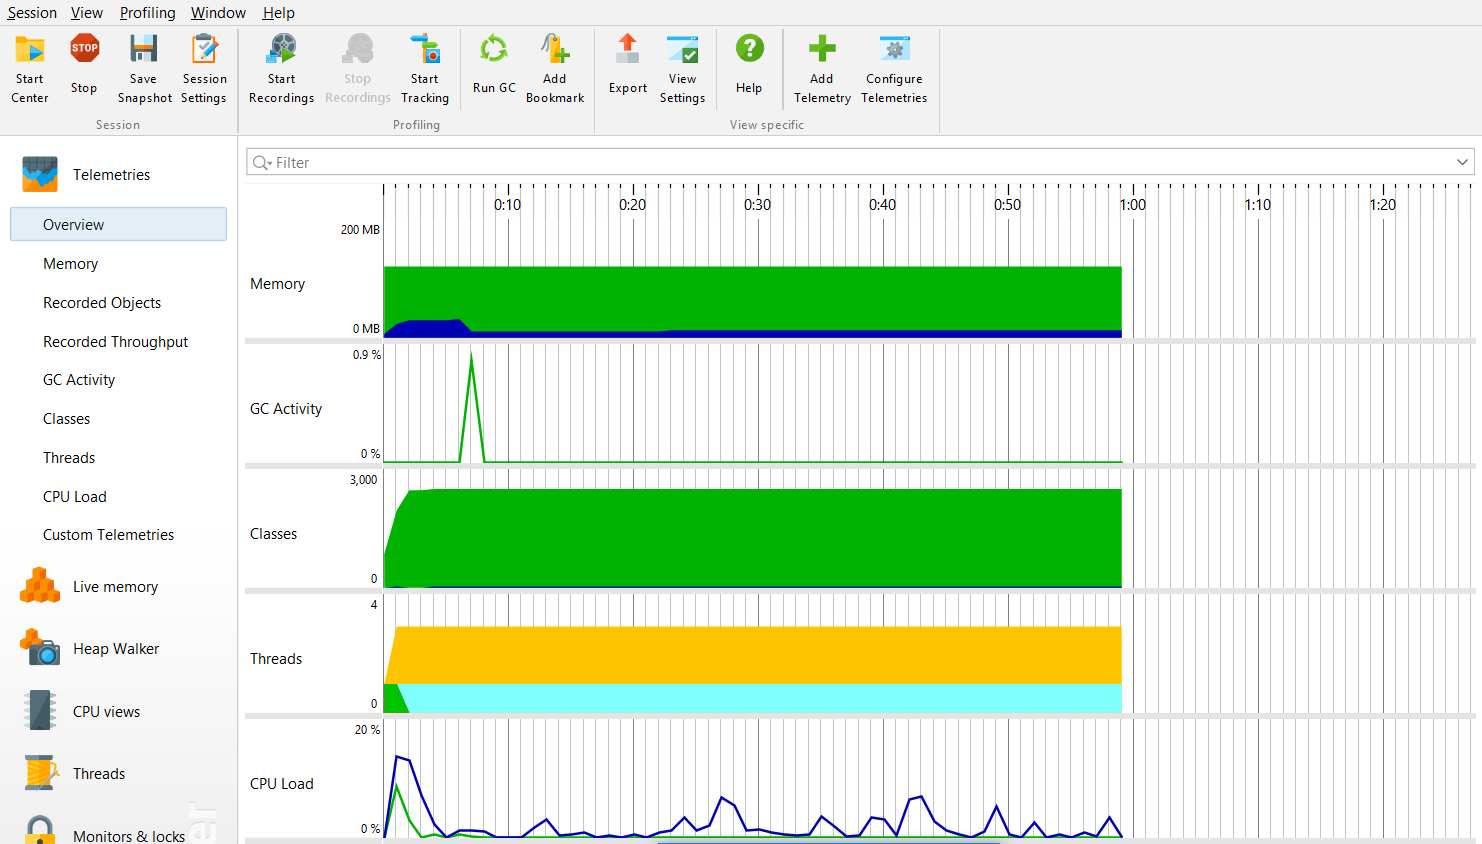
JProfiler interface overview
As you can see from the image above, it shows different components that are directly related with performance, memory and can easily help you optimize your program.
Let’s try a real use case for using JProfiler (or profiling in general) – Memory Leak detection
What is Memory Leak?
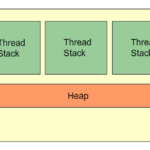
To understand memory leak, it would be a good idea if you have the fundamental knowledge about memory. In case you don’t, feel free to read this article and this one as well.
If you have written Java applications before you probably came across this widely-spread issue. What it really is, is memory that has not been released back to the pool.
Think of ths example: imagine you had to create an object that you needed. However, when you don’t need it anymore, instead of “freeing” it from the memory, you move on. What happens behind the scenes is, this object is still referenced. When the applications starts consuming more resources, it is quickly running out of resoruces and leads to OutOfMemoryError.
This is when the Garbage Collection is unable to remove these unused objects from the memory.
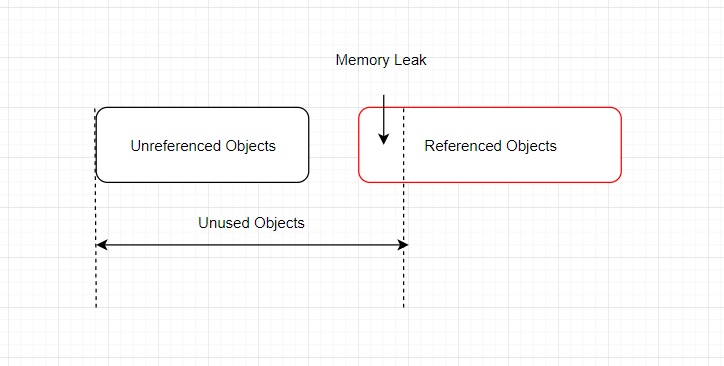
The key takeaway from the image above is – unused objects still occupy the running memory and the more resources an application has, the worse it gets and it has one outcome in the end – OutOfMemoryError.
Now that you know what Memory Leak is and that it is actually pretty serious to take into consideration when one writes an application, let’s see how Profiling can help us identify memory leaks and eliminate them.
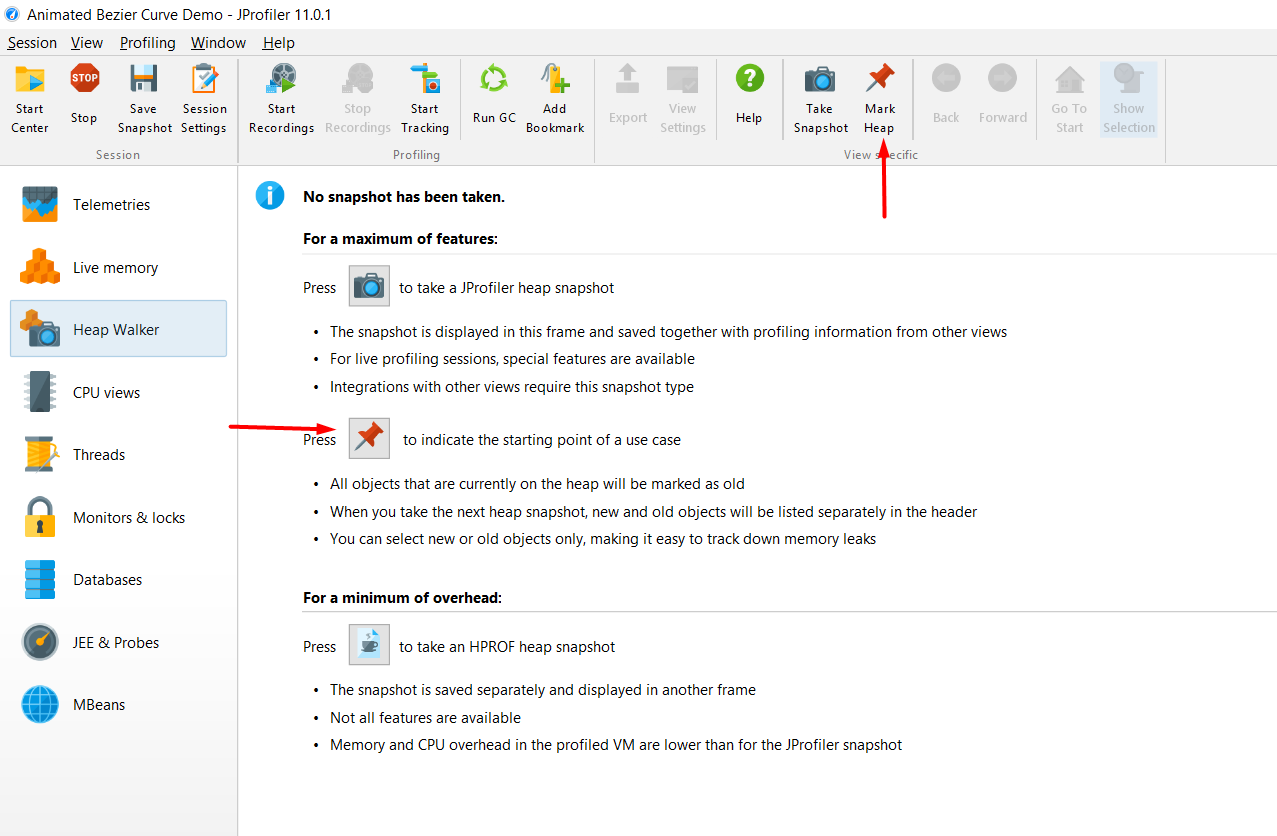
To trace memory leak easily within a Java Application, navigate to Heap walker on the left margin:
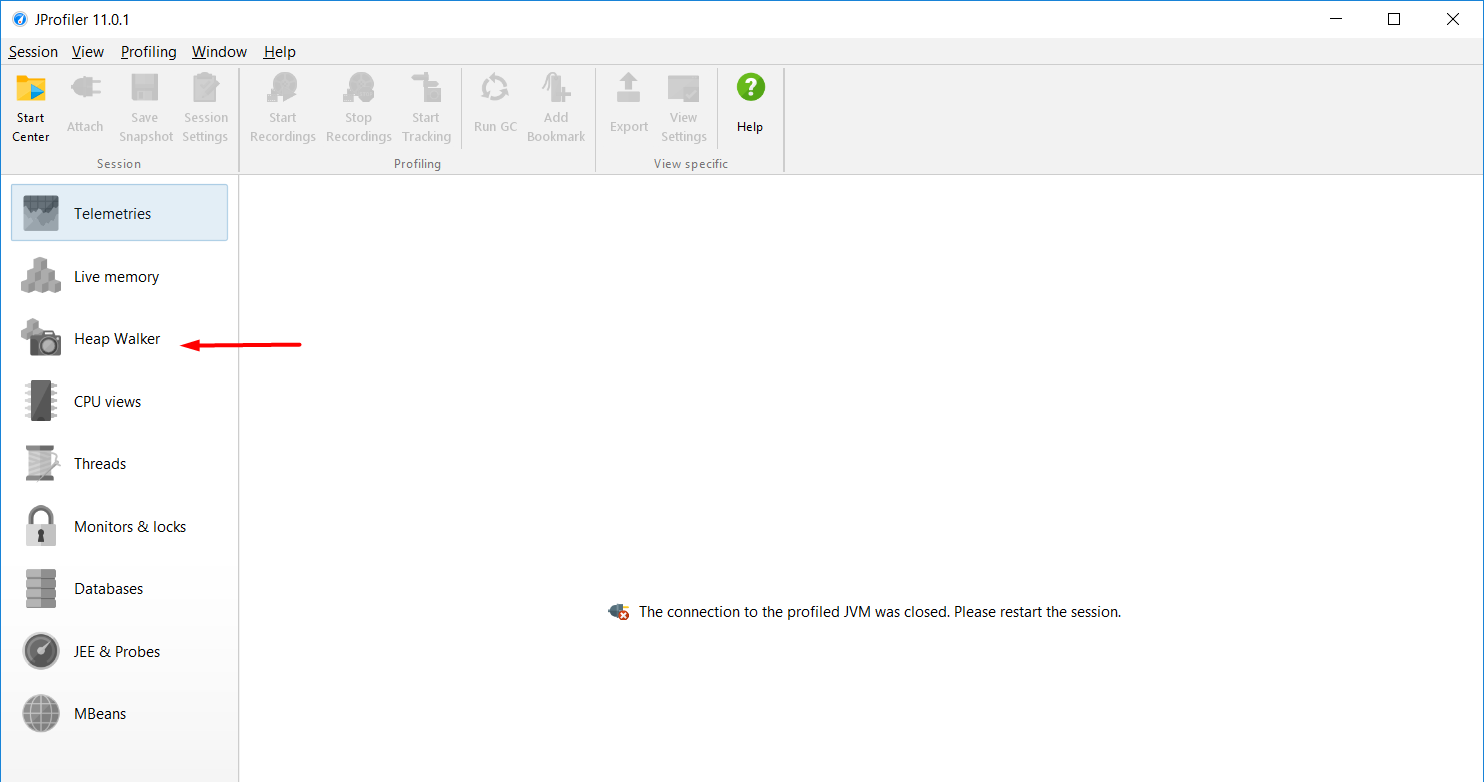
Heap walker jprofiler
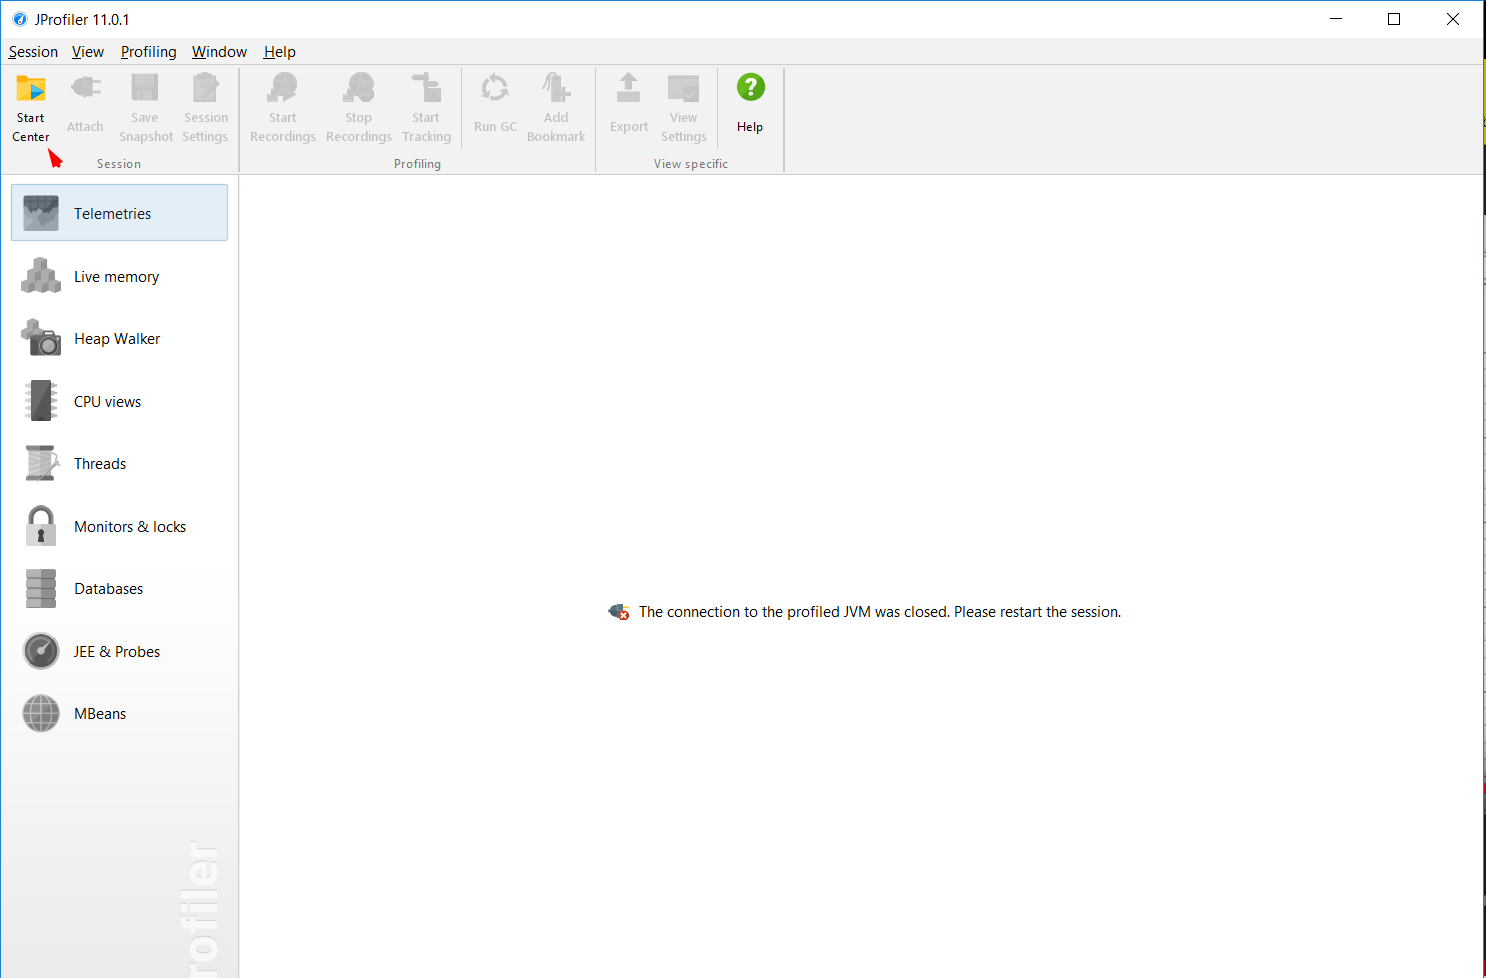
To start a Sample Project, click on Start Center on top-left corner:
Then select the first option and select Start:
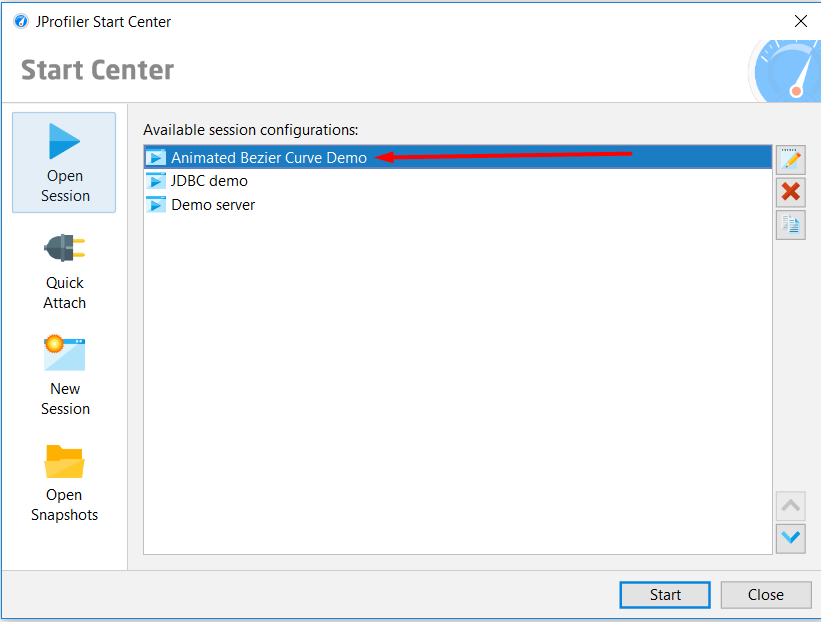
You should see this window:
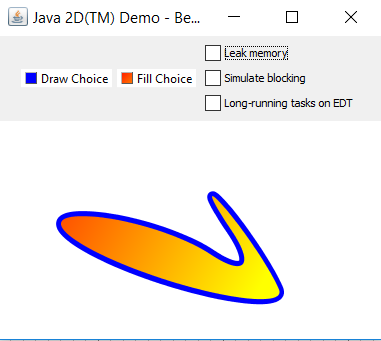
There is “Leak Memory” which we are interested in. But before clicking on it, select the Mark Heap to indicate that we are interested in newly allocated objects.
Now what this did is the application starts creating objects that are not garbage collected.
Now that we have done that, click on Memory Leak and wait some time for newly objects to be created.
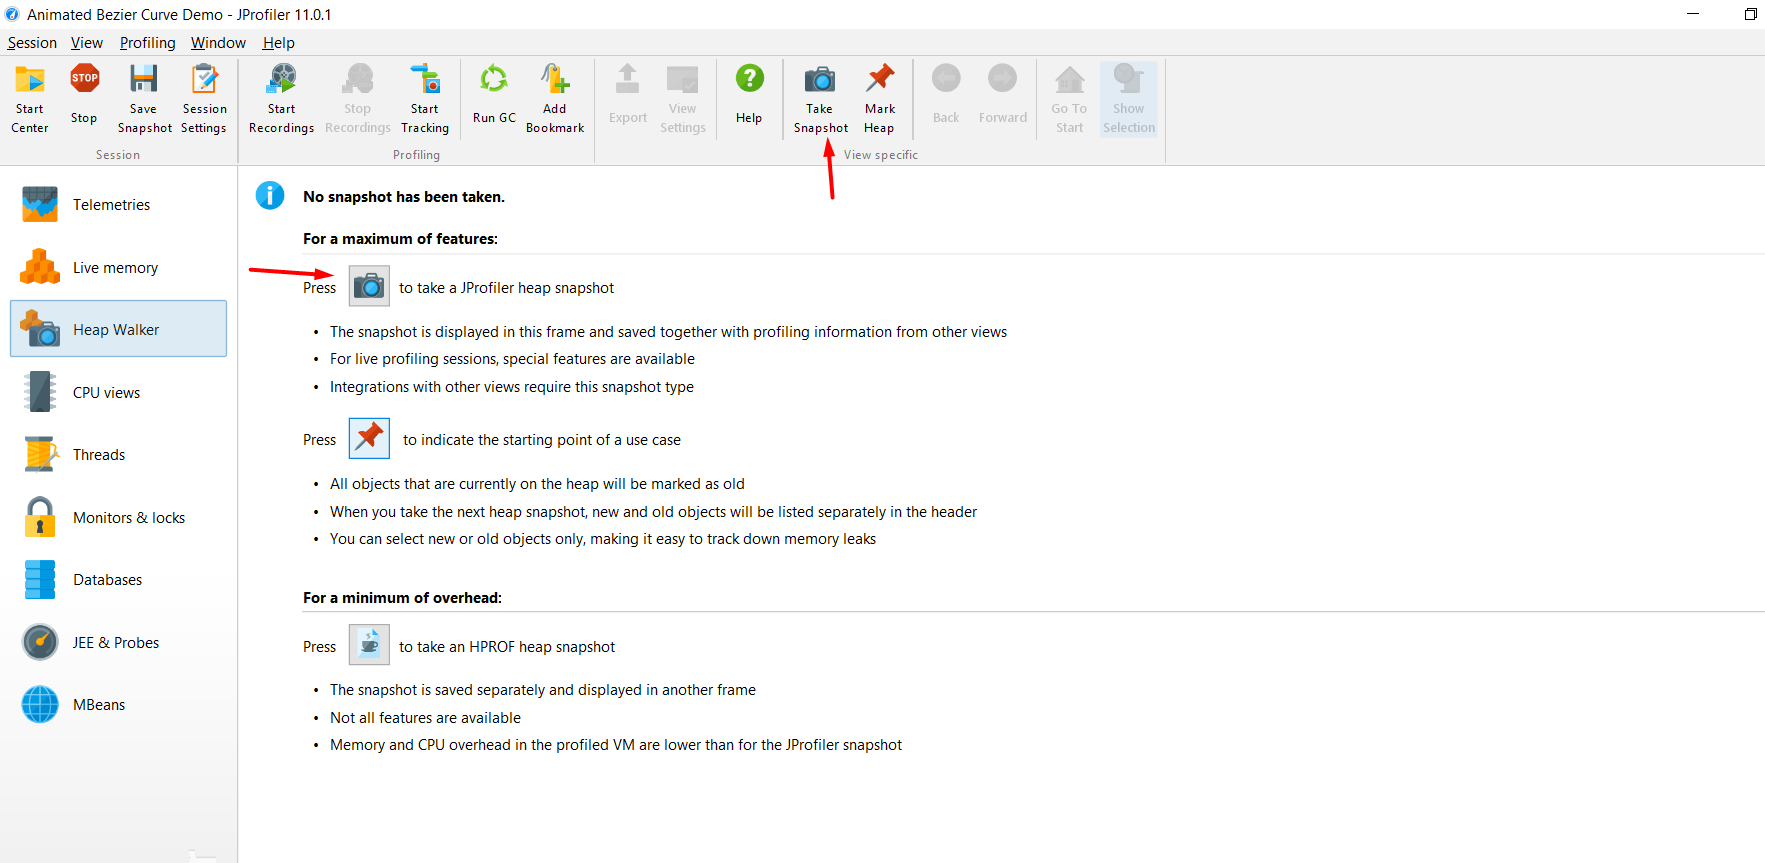
Now let’s take a Heap Snapshot:
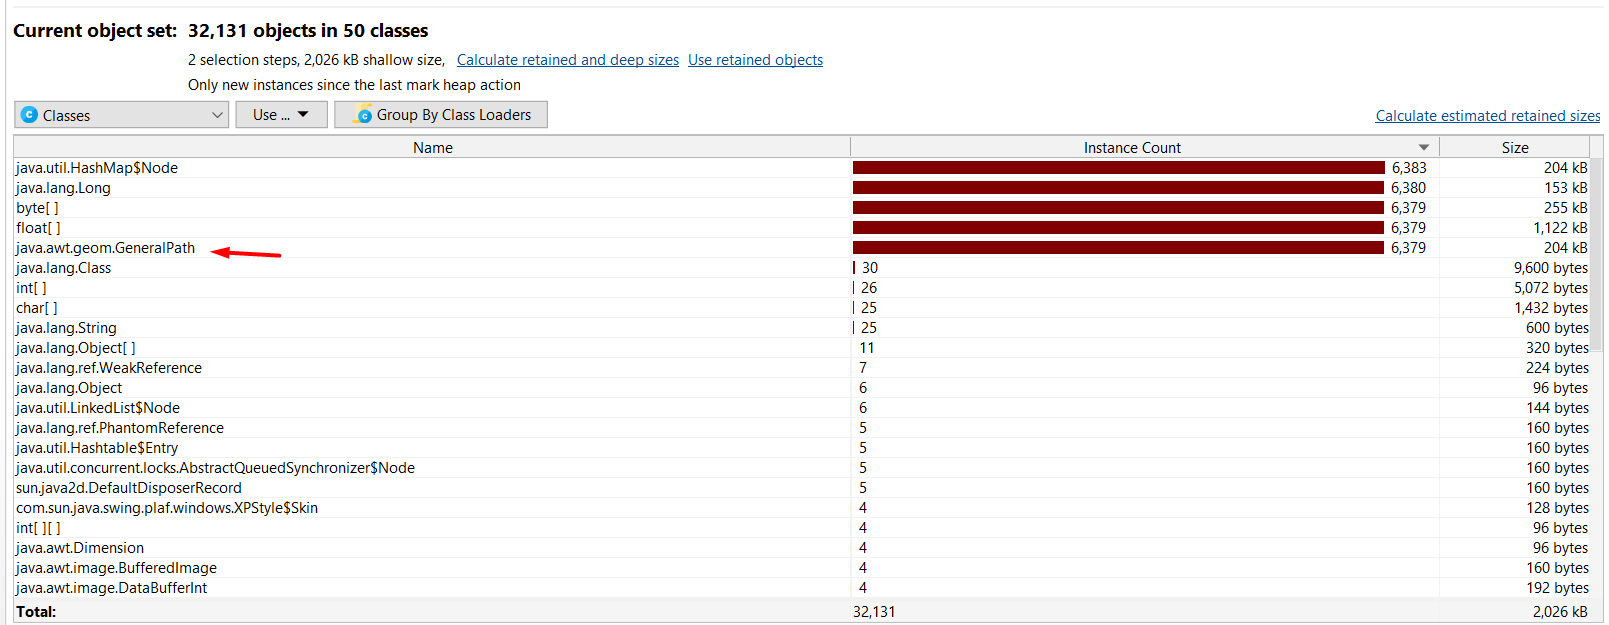
Now when we click on Heap Walker, we will see how many isntances have been created since we last marked heap action:
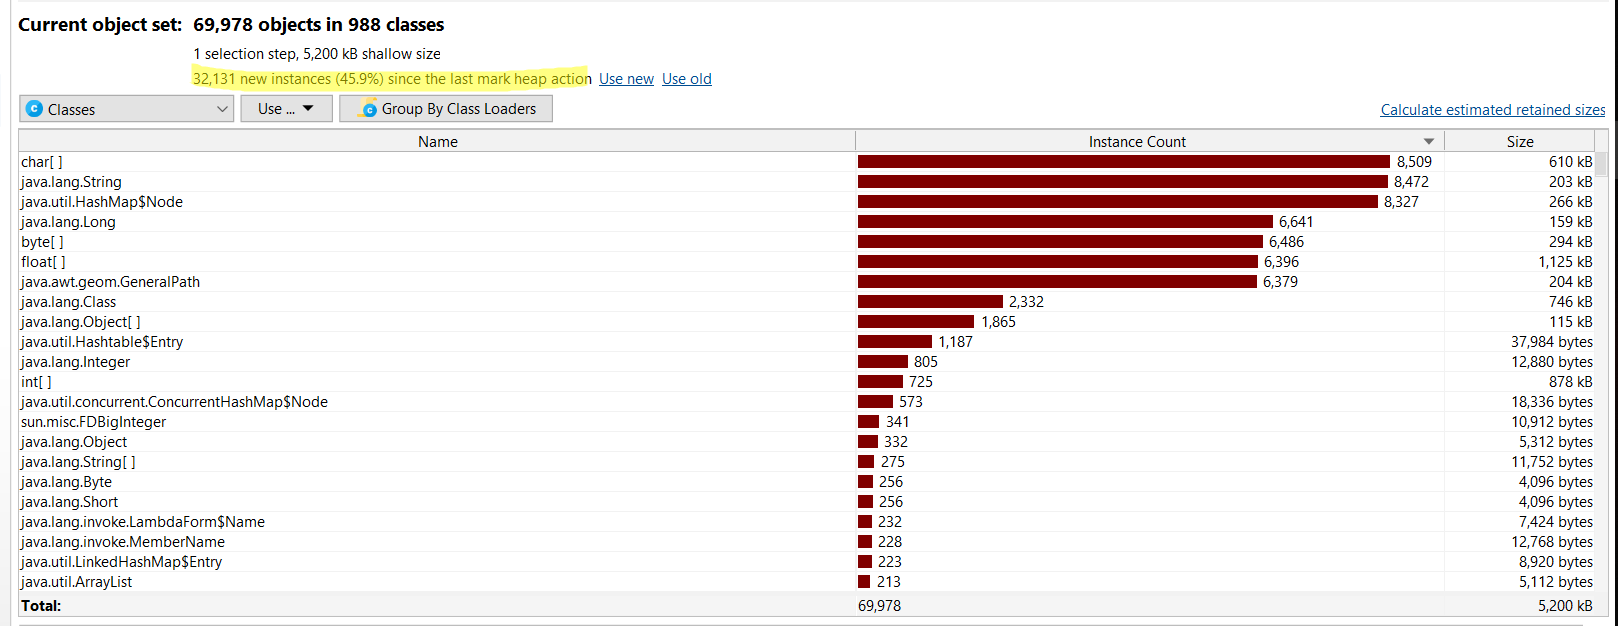
By looking at this window, we have no idea which objects are exactly participating in the memory leak. To do that, we need to click on “Use new”.
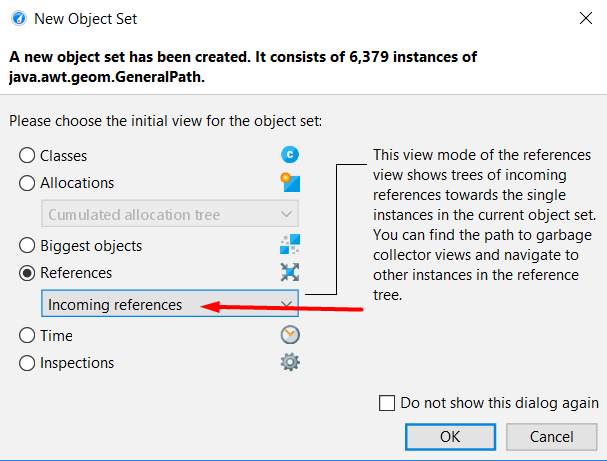
Then we will be presented with this:
Select the most general class and select incoming references and click OK:
From there, the best way to find the memory leak is to select on Show Paths To GC Root:
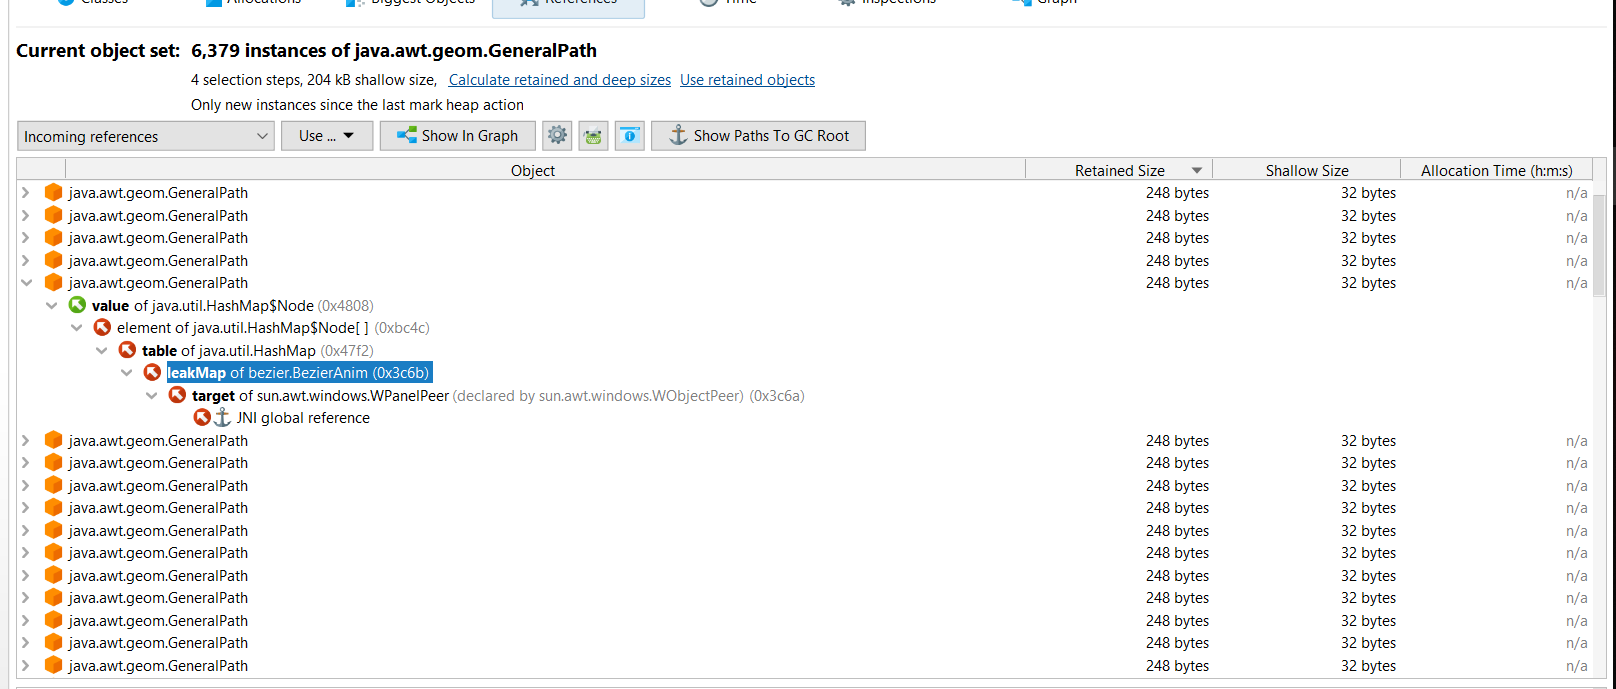
We managed to find the leak for the instance.
Conclusion
In general, testing is one of the most important techniques a programmer must be able to use. There are many tools that help testing and debugging. Some are simpler than others, like the Debug mode in Eclipse, some are more complex like JProfiler. But if you care about performance, optimization and no-memory issues, sometimes you need to dive deep into the inner-working of a given Java application.