What is profiling?
Profiling examines an application and tries to locate memory or performance issues that are associated with a Java application.What it allows you to do is obtaining data about the performance, method timing, object allocation, etc. by monitoring the JVM (Java Virtual Machine).

You can use the IDE to profile theses types of Java applications:
- Java EE/Web applications
- Java free-form projects
- Java SE projects
- NetBeans modules and module suites
JProfiler (Ej-Technologies)
When it comes to profiling tools, JProfiler is the “best” choice for many developers. It has relatively easy-to-use interface that helps inspecting the system performance, memory usage, memory leaks (if any) and thread profiling.
With all this information provided, we can diagnose our application’s behaviour and change it if we need to. Note that the image below shows a running application.
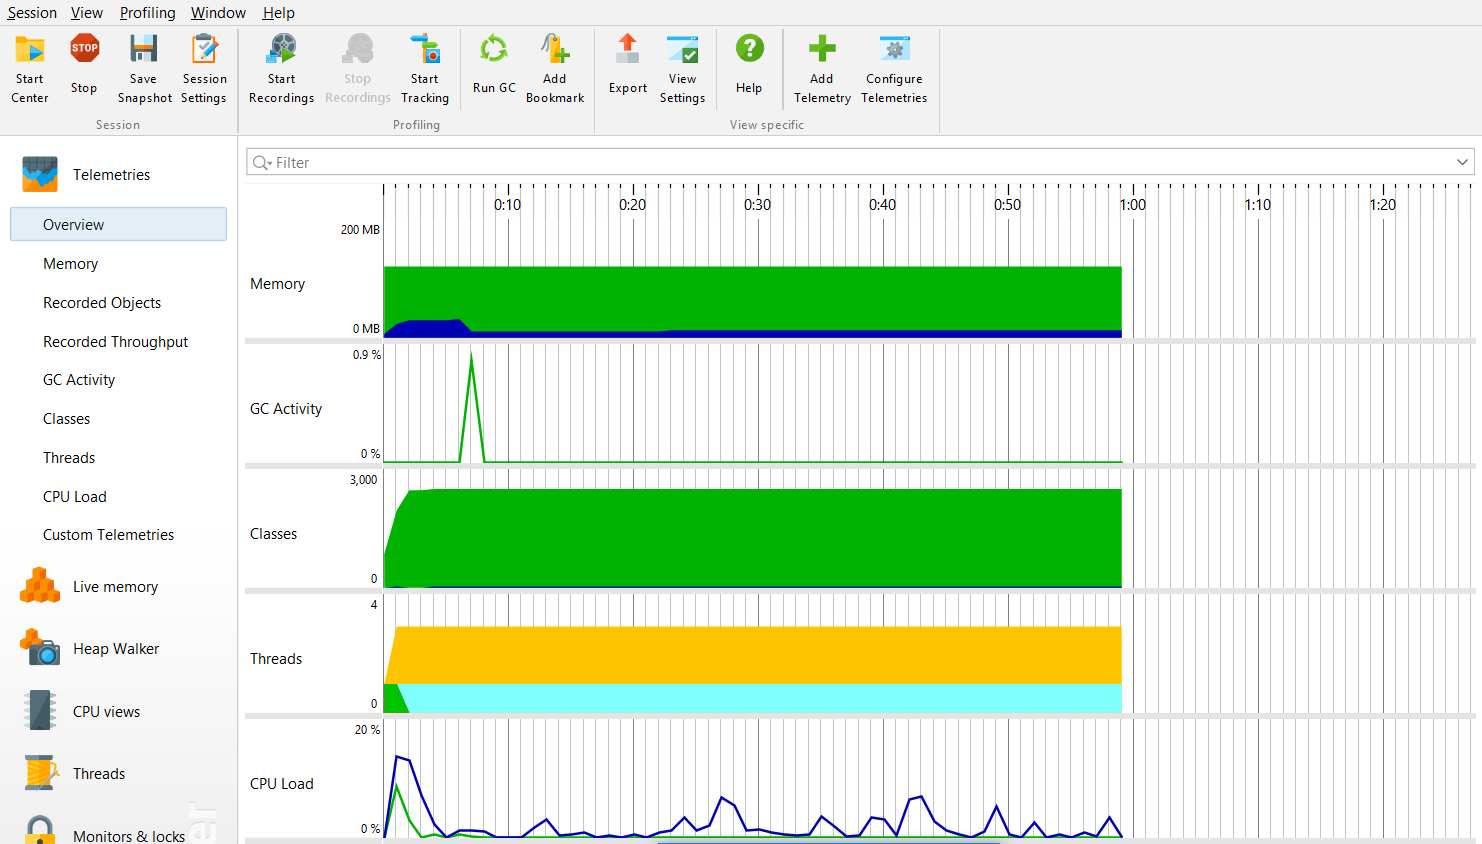
JProfiler interface overview
As you can see from the image above, it shows different components that are directly related with performance, memory and can easily help you optimize your program.
How to use JProfiler for remote profiling
There are 2 options when it comes to remote profiling:
- Direct connection
- SSH tunnel
For the direct connection, all you need is the Host and the Port. However, it is rarely possible to establish a direction connection due to restrictions that are associated with permission.
For that reason, your go-to option is SSH tunnel.
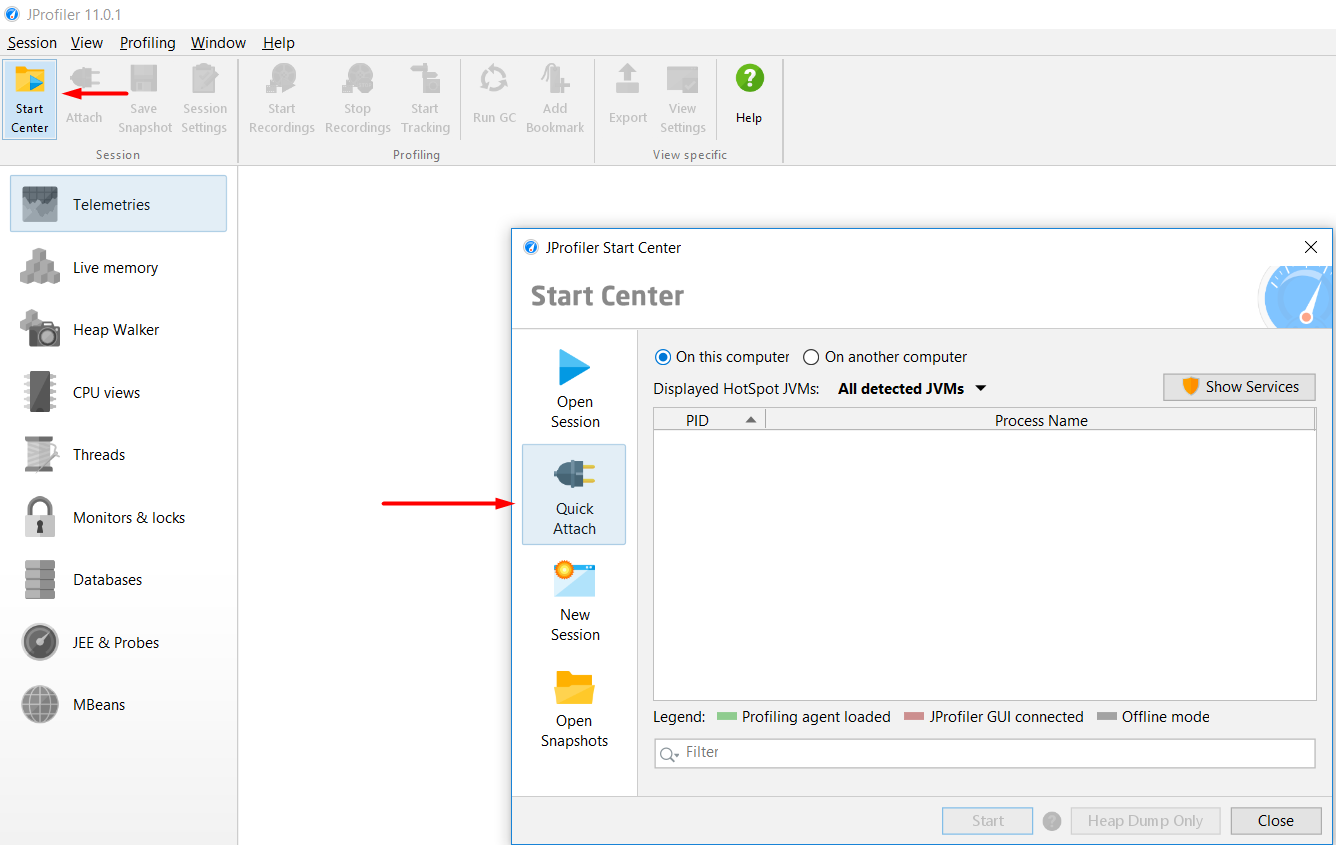
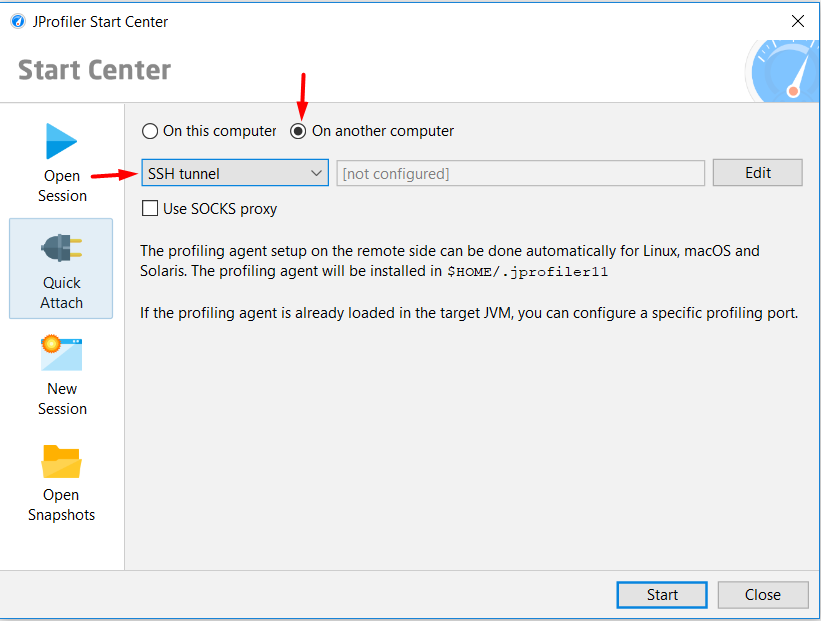
To achieve that, click on “Start Center” and then select “Quick Attach”.
After that, select “On another computer” and select SSH tunnel, like so:
When we are setting up the SSH tunnel we have got 2 more options:
1. Direct
2. General
The General option, connects to many SSH servers in order to finally reach the destionation and after have exit from the SSH tunnel, a direct network connection can be made. That is, if the profiling agent is not running directly on the SSH server.
With that bolded text in mind, we will assume that the profiling agent will be running directly on the SSH server so we will go with the [Simple] option, which is Direct.
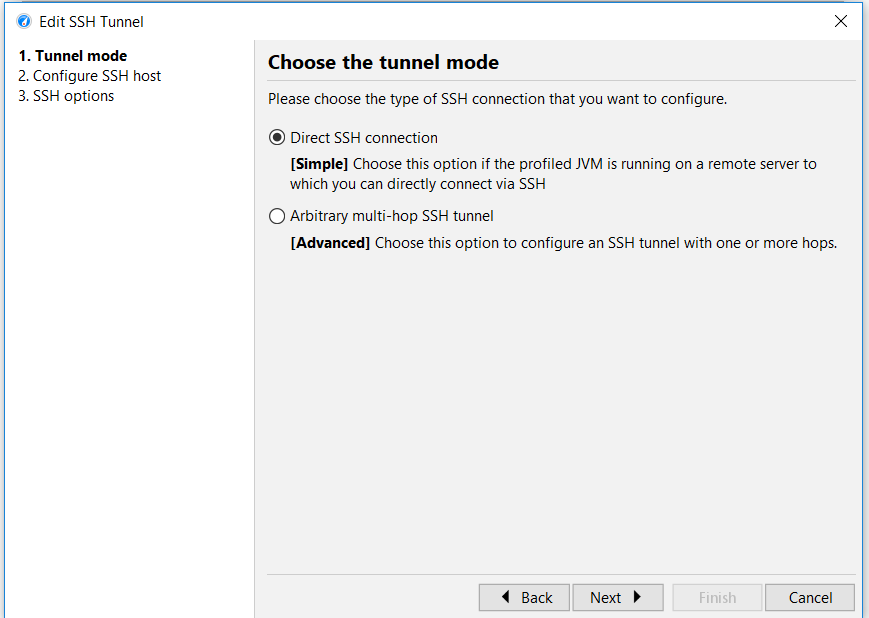
Click on Direct if the profile JVM is already running on the remote server.
As you can see from the image above, we have got 3 steps: first is selecting the Tunnel mode, then Configuring the SSH host and then the SSH options.
We will go through each one of these options.
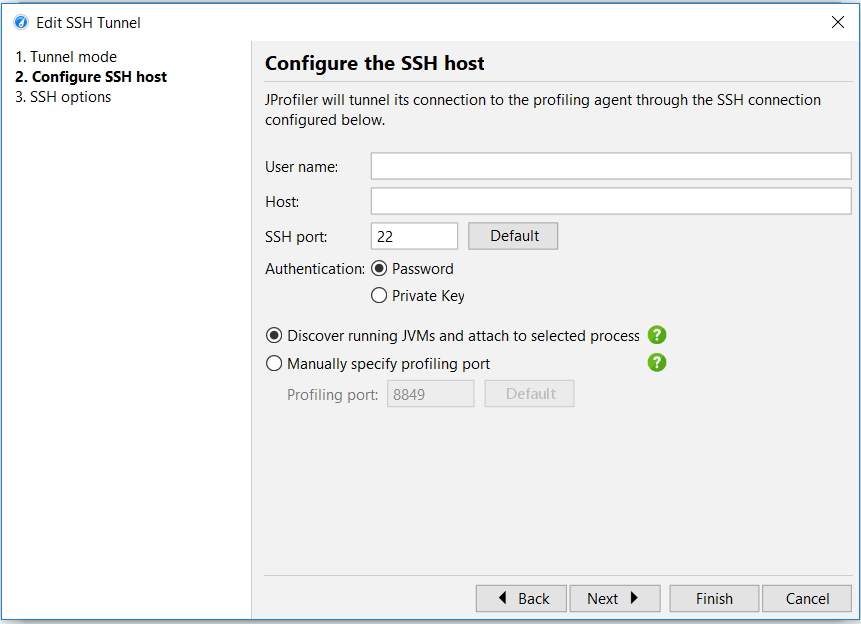
This is the “Configure the SSH host” step. In here, a User name, Host and an authentication method (Password/private key) and profiling port.
The profiling port has either been configured in the integration wizard or is the jpenable command line tool.
To get the Profiling port using jpenable,you have to run it. jpenable is contained within the bin directory.
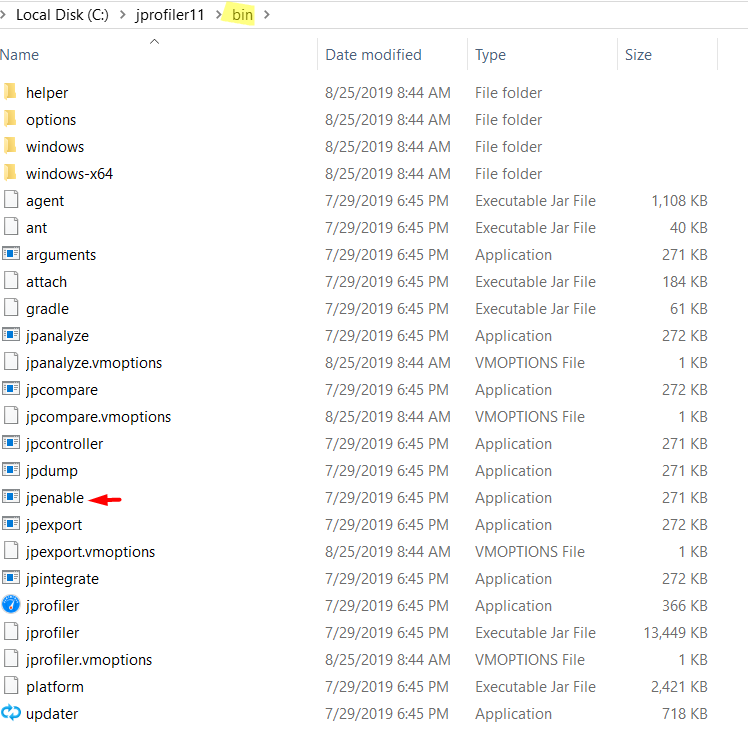
Now you have to type the following in the command line:
jprofiler/bin/jpenable
After you run it, click Enter and it is going to give you the default port you will need to finally attach remotely:
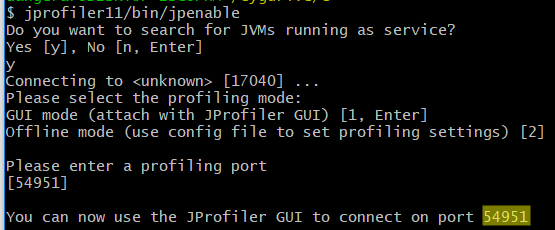
Go back to JProfiler, paste the port jpenable gave you, click Finish, then Start and boom! You are done. You successfully connected to your app running remotely.
If you want to know how to profile a standalone java application you can view my other tutorial on the topic linked below.