In this post, I’ll teach you multiple methods for capturing java heap dump. Critical for memory consumption optimisation, a heap dump is described as a memory print of the Java process.
Java heap dump is an essential object for diagnosing memory-linked issues including java.lang.OutOfMemoryError, Garbage Collection issues, and memory leaks (slow), which are all part of java web development.
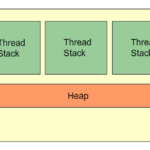
For clarity, a Heap dump contains information such as Java classes and objects in a heap during instant of taking the snapshot.
Tools that can help you analyse the heap dumps include Heap Hero and Eclipse MAT. But, you’ll still require to provide the tools with the heap dumps that are captured during right time and correct format.
1. jmap – XX:+HEAPDUMPONOUTOFMEMORYERROR
Notably, the jmap will print your heap dumps to a particular file location. The jmap tool is usually packaged inside the JDK. You can find it in this folder: <JAVA_HOME>\bin.
To invoke jmap, follow the below process.
jmap -dump: live, file=<file-path> <pid>
in which pid is a Java Process Id, for which the heap dump will be captured
Also, the file-path is a file path in which the heap dump is printed.
Note that it is critical to passing “live” selection. When the option will be “passed”, you’ll only have live objects being written to your heap dump file. However, if you fail to pass the option, all objects including ones that are not set for garbage collection would be printed onto the heap dump. Such a mistake would excessively and unnecessarily increase the size of its heap dump. You can avoid such errors by contracting your Mobile development needs to a Java Development Company.
2. HeapDumpOnOutOfMemoryError
It’ll be critical to capturing an instantaneous heap dump at the time your application encounters the java.lang.OutOfMemoryError.
Such a process would assist in determining the objects occupied in the memory and the amount of space (in percentages) they had occupied at that point of occurrence of the java.lang.OutOfMemoryError.
But, because of the many operations and technicalities, the operations groups could fail to capture the heap dump. In addition, the team might also have restarted the application. Therefore, heap dump capturing becomes a critical aspect of the system applications, particularly when it comes to memory issues.
Luckily, the XX:+HeapDumpOnOutOfMemoryError option would help in that process. You’ll only require to pass the system property (XX:+HeapDumpOnOutOfMemoryError) in the startup of the application. Then, JVM will do the rest by capturing the heap dumps at the exact time the JVM faces OutOfMemoryError.
Notably, head dump that will be captured in the case above would be printed in the location outlined by the system property named ‘-XX: HeapDumpPath’
3. jcmd
The jcmd tool is employed in sending command requests for diagnostic of your java JVM. Equally, the jcmd tool is included in the JDK package. You can get it in the folder named \bin.
Here’s the process you’ll need to use in invoking the jcmd;
- Go to
jcmd <pid> GC.heap_dump <file-path> - In which
- pid: is a Java Process Id, for which the heap dump will be captured
- Also, the file-path: is a file path in which the heap dump is be printed.
Conclusion
In this post, I’ve discussed the three main processes you can use to capture java Heap dump: (1) jmap – XX:+HEAPDUMPONOUTOFMEMORYERROR (2) HeapDumpOnOutOfMemoryError and (3) jcmd.